Evaluation of the Spatial Arrangement of Rabbit Hepatocytes Based on Voronoi Tessellation Following Exposure to Zinc Oxide Nanoparticles
-
Moasses, Zia
-
Department of Anatomical Sciences, School of Medicine, Shiraz University of Medical Sciences, Shiraz, Iran
-
Aryan, Arefeh
-
Department of Anatomical Sciences, School of Medicine, Lorestan University of Medical Sciences, Khorramabad, Iran
-
 Mesbah, Fakhroddin
Department of Anatomical Sciences, School of Medicine, Shiraz University of Medical Sciences, Shiraz, Iran, Tel: +98 71 32304372; Fax: +98 71 32304372; E-mail: mesbahf@sums.ac.ir
Mesbah, Fakhroddin
Department of Anatomical Sciences, School of Medicine, Shiraz University of Medical Sciences, Shiraz, Iran, Tel: +98 71 32304372; Fax: +98 71 32304372; E-mail: mesbahf@sums.ac.ir
-
Mirzaei, Esmaeil
-
Department of Medical Nanotechnology, School of Advanced Medical Sciences and Technologies, Shiraz University of Medical Sciences, Shiraz, Iran
-
Nanomedicine and Nanobiology Research Center, Shiraz University of Medical Sciences, Shiraz, Iran
Abstract: Background: Zinc oxide nanoparticles have been utilized in different fields over the last decades. These nanoparticles can pose significant risks to various organs such as the liver. This study aimed to evaluate the effects of zinc oxide nanoparticles on liver histology, serum biochemistry, and spatial arrangement of the hepatocytes in the female New Zealand white rabbit.
Methods: The rabbits received 1, 5, and 10 mg/kg of the zinc oxide nanoparticles (ZnO NPs) intraperitoneally once every 3 days for 28 days. The serum levels of the aspartate aminotransferase, alanine aminotransferase, alkaline phosphatase and zinc were assessed 48 hr following the first administration. The histopathological changes and Voronoi tessellation were evaluated after the last administration.
Results: Our findings showed that the ZnO NPs significantly increased the serum levels of aspartate aminotransferase, alanine aminotransferase, alkaline phosphatase, and zinc. The histopathological findings showed ballooning degeneration, and sinusoidal congestion in ZnO NPs administrated groups. The Voronoi tessellation diagrams also confirmed that ZnO NPs changed the regular spatial arrangement of hepatocytes to random and cluster patterns.
Conclusion: In conclusion, the ZnO NPs alter the liver spatial arrangement and induce hepatic pathological changes that may affect liver function in rabbits.
Introduction :
The liver is the primary organ for detoxification, glycogen storage, bile formation, protein synthesis, and general homeostasis 1. Hepatocytes are the main parenchymal cells which represent 60–70% of total hepatic cells, while Kupffer (Macrophage) cells (KCs), sinusoidal endothelial cells, and hepatic stellate (Ito) cells constitute the major non-parenchymal cells population of the liver 2. As the main organ of metabolism, detoxification, and fine adjustment of the immune system 2, the liver is constantly exposed to some exogenous factors such as viruses, alcohol, drugs, pesticides, and nanoparticles 3. These pathogenic elements are mainly hepatotoxic and may lead to severe inflammation, irreversible liver damage and changes in hepatic biochemical profiles 4. Among the various materials, zinc oxide nanoparticles (ZnO NPs) have high cytotoxicity due to their special physical and chemical properties such as shape, electric charge, nanoscale size, extraordinary surface area and protein binding 5. Accurate identification of all the aspects of the physical and chemical properties of ZnO NPs is inevitable to find out their toxicity, which can be characterized by using different techniques such as Scanning Electron Microscope (SEM) and Fourier Transform Infrared spectroscopy (FTIR) 6.
The SEM technique detects directly the size, shape, and morphology of nanoparticles 7. Previous studies have shown that smaller ZnO NPs (<30 nm) are more hepatotoxic than their counterpart bulk particles 8. The small-size ZnO NPs accumulate in the liver through oral, dermal, inhalational, intravenous, and intraperitoneal (I.P.) administration 9,10. In addition, the shape of ZnO NPs may impact their hepatotoxic effects, as ZnO nanorods penetrate cell membranes more easily than their spherical or cuboidal ones 11.
Sharma et al illustrated the histopathological changes in mouse liver after sub-acute exposure to ZnO NPs for 14 days. The orally administrated ZnO NPs (300 mg/kg) significantly accumulated within the liver and induced oxidative stress, DNA damage and apoptosis. Furthermore, the elevated levels of serum hepatic profiles, specifically Aspartate Aminotransferase (AST), Alanine Transaminase (ALT), and Alkaline Phosphatase (ALP) were indicative of hepatic lesions 12. Another study by Pei et al concluded that the I.P. administration of ZnO macro and nanoparticles (25 mg/kg) for 7 consecutive days caused hepatic toxicity in Sprague-Dawley rats. Compared to macro-scaled particles, the ZnO NPs displayed higher hepatic oxidative stress, elevated levels of serum biomarkers, and ultrastructural changes such as increased intercellular space, pyknotic nuclei, incomplete endoplasmic reticulum and disrupted mitochondrial crest 9.
The liver injury caused by ZnO NPs may change the spatial distribution of hepatocytes and thereby impair liver function. To maintain normal liver functions, the parenchymal and non-parenchymal cells must be in the right distribution, architecture and spatial geometry and in contact with each other and another cell of the liver 13. Various techniques and algorithms such as Voronoi diagrams have been used for the pathological analysis of the liver structure 14,15. The spatial arrangement of hepatic tissue involves dividing the epithelium into smaller polygonal areas (cell boundaries) so that each polygon is dominated by a cell nucleus 16,17. In this study, we hypothesized that ZnO NPs may affect the normal function of the liver by changing the spatial distribution of hepatocytes. Therefore, the present work was performed to investigate the effects of ZnO NPs on the hepatocyte spatial arrangements and liver architecture in the female New Zealand White (NZW) rabbit using the Voronoi tessellation technique.
Materials and Methods :
Measurement of ZnO NPs properties: The morphology and size of powdered ZnO NPs (10-30 nm) (C US Research Nano Materials, Inc. CAS No. 1314-13-2) were evaluated by SEM (TESCAN, VEGA3). The functional groups and chemical structure of ZnO NPs were analyzed by Fourier-Transform Infrared (ATR-FTIR) spectroscopy (Bruker, Germany) in a spectral range of 400-4000 cm−1 at room temperature. The hydrodynamic size of ZnO NPs was measured by Dynamic Light Scattering (DLS) technique (HORIBA SZ-100).
ZnO NPs preparation: The Polyethylene Glycol 6000 (PEG 6000) solution (0.01 M) was prepared to stabilize ZnO NPs. The PEG 6000 was added to 100 ml deionized water and stirred for 15 min. Therefore, 1 g ZnO NPs powder was added to PEG solution and stirred for 24 hr at room temperature. An ultrasonic probe (80 amplitude) dispersed the ZnO NPs for 15 min. The ZnO NPs suspension was centrifuged and washed with distilled water (×3) to remove free PEG molecules. The ZnO NPs were dispersed in 100 ml distilled water again to achieve 10 mg/ml ZnO NPs suspension. Other concentrations of ZnO NPs (1 and 5 mg/ml) were prepared as mentioned above. The ZnO NPs suspensions was stored at 37ºC away from light and stirred before I.P. injection to prevent nanoparticle agglomeration 18.
Study design: The female NZW rabbits (5 months old) approximately 1.8 kg were purchased from the Center of Comparative and Experimental Medicine Shiraz University of Medical Sciences, Shiraz, Iran. The rabbits were housed in individual cages under controlled light and temperature conditions (12 hr light: 12 hr dark cycle, temperature 20–22°C). The food and water were available ad libitum. After one week of acclimatization, the 25 NZW rabbits were divided equally into 5 groups and were treated as follows once every 3 days for 28 days (Figure 1). The control group was subjected to experimental conditions without any treatment, the vehicle group received 1 ml/kg of deionized water, the Low Dose (LD), Medium Dose (MD) and High Dose (HD) treated groups were intraperitoneally received 1, 5 and 10 mg/kg/ml ZnO NPs suspensions respectively 19.
Serum analysis: Blood samples were taken from the rabbit ear marginal vein 48 hr after first dose, and stored in clotting activator tubes for 30 min 20. The samples were then centrifuged at 3000 rpm for 10 min and the serum was frozen at -20°C after collection. The serum levels of aspartate AST, ALT, and ALP were analyzed using assay kits (BioSystem, Spain-Barcelona) and a fully automated biochemical analyzer (BT 3000 plus). The serum zinc levels were also measured using a spectrophotometer and assay kit (LTA.s.r.l. Milano, Italy) 21.
Histopathology: One day after the last administration of ZnO NPs, the rabbits were euthanized with CO2 and three random tissue samples (1-2 cm3) were collected from different regions of the liver. The samples were then fixed in 10% neutral buffered formalin for 48 hr at room temperature 22. The samples were dehydrated in ethanol, cleared in xylene, and embedded in paraffin. The blocks were cut into 5 μm thickness sections, stained with Hematoxylin and Eosin (H & E), and observed for histopathological changes by light microscopy (Olympus, Tokyo, Japan).
Voronoi tessellation: The hepatocytes were mapped using the Fiji Image J (USA). This software sets a polygon area around the hepatocyte. To draw the Voronoi polygon diagram, we analyzed 10 liver tissue sections from each animal using the video-microscopy system. The microscopic images were gained with an objective lens of 40×. The favored parameter was the nucleus of the hepatocytes. The instructions are listed below:
A) Import the desired image into Fiji Image J software. B) Import the 40× lens scale bar image to the software as well. C) In the ''analysis'' folder, select ''set scale''. Draw a straight line on the scale bar image and determine the desired distance (for example, 50 µm=241 pixels (Figure 2A). D) In the ''plugin'' folder, click the ''analysis'' option and then'' Voronoi tessellation''. E) To draw Voronoi polygons, click the ''multipoint'' and mark the nucleus of each cell. F) Take a screenshot of the obtained polygons and save it. Then import the screenshot to the software. G) In the ''Image'' folder, select ''Type'' and ''8 bit'' options (Figure 2B). H) Click ''adjust'' and ''threshold'' so that the background becomes white and the polygons will be seen in black. I) Click Wand (tracing tool) and select the desired polygon. Then right-click on the polygon and select measure to calculate the area, perimeter, mean, and Standard Deviation (SD) (Figure 2C).
In the current work, the variability of polygon areas was analyzed by their variance 23. The coefficient of variation or Coefficient of Variation (CV) is the ratio between the standard deviation and mean value of the polygon areas. The CV that is a classification and not a statistical comparison indicates the spatial distribution of hepatocytes:
1) The CVs less than 33% (<33%) are associated with regular pattern, 2) The CVs of 33.1-64% indicate the random arrangement of hepatocytes, 3) The CVs more than 64% (> 64%) are considered as a clustered distribution 24.
CV=SDmean×100
Ethical consideration: The experiments were performed in accordance with national norms and standards for conducting medical research in Iran and this project was approved by the Ethics Committee of Shiraz University of medical Sciences, Shiraz, Iran (Approval ID: IR.SUMS.REC.1398. 955).
Statistical analysis: The non-parametric data were analyzed using Kruskal-Wallis test followed by Dunn’s multiple comparion test (Graph Pad Prism software version 8.0). The p<0.05 or less was considered to be a significant difference.
Results :
ZnO NPs characterization: The FTIR spectroscopy showed that ZnO NP bands occurred in the range of 410-3400 cm-1. The peaks at 410, 433 cm-1, and 510 cm-1 were stretching vibrations of Zn-O bands (Figure 3A). The peaks at 1122, 1400 and 1484 were attributed to C=O and C-O bands, while the peaks around 3400 cm-1 corresponded to OH stretching vibration. The SEM results revealed spherical ZnO NPs with an average diameter of 38±9 nm (Figure 3B). The DLS analysis also exhibited a considerably narrow size distribution of ZnO NPs with a hydrodynamic size of 62 nm (Figure 3C).
Serum biochemical profiles: The serum levels of AST and ALT enzymes were significantly increased in the HD (10 mg/kg/ml ZnO NPs) group compared to the Control and Vehicle groups (p<0.05) (Figures 4A and 4B). In addition, the ALP enzyme levels were significantly increased in the HD group compared to the Control and Vehicle groups (p<0.01) (Figure 4C). Our serum analysis also exhibited a significant increase in zinc levels in HD group as compared to Control and Vehicle groups (p<0.05) (Figure 4D).
Histopathological results: Liver tissue sections of the control and vehicle groups showed intact lobular architecture, normal hepatocytes, sinusoids, Kupffer cells and intact hepatic portal triads (Figures 5A and 5B). In LD (1 mg/kg/ml ZnO NPs) group, we observed mild ballooning degeneration of hepatocytes. Some hepatocytes also remained intact and had acidophilic cytoplasm with spherical nuclei (Figure 5C). The structure of the portal triad (the hepatic artery, portal vein, and bile duct) remained normal. In the MD (5 mg/kg/ml ZnO NPs) group, the hepatocytes exhibited moderate ballooning degeneration with cytoplasmic vacuolation (Figure 5D). The blood congestion in hepatic sinusoids was observed (Figure 5E) and portal space was mildly infiltrated by inflammatory cells. In the HD (10 mg/kg/ml ZnO NPs) group, the structure of the portal triad remained intact and blood congestion in hepatic sinusoids, portal, and central veins was distinct. As shown in (Figure 5F) and reflected in (Table 1), the hepatocytes showed extensive ballooning degeneration with cytoplasmic vacuolation. The hepatocytes had swollen and balloon-shaped cytoplasm with a cloudy appearance. In addition, mild forms of focal (spotty) necrosis and infiltration of inflammatory cells were detected in the portal zone or hepatic parenchyma (Figures 5G and 5H).
Spatial arrangement: The Voronoi photographs revealed that the hepatocytes were pentagonal and hexagonal in all experimental groups (Figure 6). Trigonal, tetragonal, heptagonal, and octagonal shapes also formed a smaller population of cells (Table 2). Our analysis indicated that the average perimeter of the hepatocyte in control group was 65.59±1.83 µm. There was a significant increase in the hepatocyte perimeter for MD (74.86±8.3) and HD (76.74±5.31) groups compared to the control (Figure 7A). The Voronoi tessellation analysis also revealed that the average hepatocyte area in control group was 250.10±15.28 µm2. The ZnO NPs administration significantly increased the hepatocyte area in MD (303.51±59.92) and HD (324.21±54.66) groups as compared to the control (Figure 7B). The mean CVs of the area of the polygon in the control and vehicle groups were located in the regular range of <33%. The CVs of the polygon's area of LD and MD groups were located in the random range of 33-64% and the CVs of the polygon's area of the HD group were located in the cluster range >64% (Figure 7C).
Discussion :
For the first time, we have studied the spatial arrangement of hepatocytes in rabbits after exposure to different doses of ZnO NPs. Our findings indicated that, the Voronoi diagrams were approximately related to the boundary of each hepatocyte and pentagons and hexagons represented the most common shapes of Voronoi polygons in the rabbit liver. As far as we know, only Lau et al have described the normal spatial arrangement of hepatocytes in human and pig. They discovered that the pentagons (40%) and hexagons (32.5%) are the predominant shapes of hepatic Voronoi polygons in pigs. However, the heptagons (34%) followed by the hexagons (32%) were the most common forms of hepatic Voronoi polygons in humans 25. We suggested that exposure to ZnO NPs led to disorganization and redistribution of hepatocytes in space.
The CV of the polygon areas was found to be useful for characterizing the regularity of the hepatocyte patterns after exposure to ZnO NPs. To the best our knowledge, the CV is the only parameter that has been utilized to classify the spatial arrangement of neurons 26,27 germ cells and epithelial tissue 28 in normal and pathological conditions. Our data showed that the CV in the control and vehicle groups was low (<33%) and hepatocytes had a regular spatial distribution. However, after exposure to ZnO NPs, the CV increased and the hepatocytes exhibited a random arrangement in the LD (1 mg/kg/ml) and MD (5 mg/kg/ml) groups. In addition, the administration of ZnO NPs caused a clustered spatial arrangement in the HD (10 mg/kg/ml) group. These data support the findings of Pardeshi et al 29, who observed disorganization and disorientation of hepatic cords in chicken embryos by ZnO NPs (50 and 150 µg/g egg weight). Furthermore, the hepatocytes exhibited cytoplasmic vacuolation and had lost their normal cellular integrity.
In the case of our study, spatial disarrangement of hepatocytes may be associated with the toxic effects of ZnO NPs on the liver. The physicochemical properties of ZnO NPs such as shape, size, and chemical bands are the main factors that influence the liver toxicity 30-32. Therefore, we characterized these unique features using FTIR, DLS and SEM. The FTIR analysis identified peaks at 410.01-510.01 cm-1 as ZnO bands 33. The DLS analysis also indicated that the mean hydrodynamic diameter of ZnO NPs was 62 nm and the nanoparticles represented a remarkably narrow size distribution. However, the SEM result showed that the average size of spherical ZnO NPs (dry powder) was 38±9 nm. The DLS represented a larger size of ZnO NPs than the SEM images which could be related to the agglomeration of the NPs in distilled water resulting in a larger hydrodynamic size detection 34,35. It has been suggested that the accumulation of ZnO NPs in hepatocytes is size-dependent 36. Al Mansour et al 37 reported rat liver injury upon exposure to small-size ZnO NPs (<35 nm) for 21 days. The ZnO NPs (2 mg/kg) crossed the hepatocyte cell membrane after I.P. injection and induced mitochondrial swelling, endoplasmic reticulum damage and nuclear chromatin fragmentation. The route of administration is another key factor influencing ZnO NP hepatic toxicity 38. Compared to other routes of administration, the I.P. injection provides a higher rate of absorption and bioavailability of ZnO NPs 39,40. In the current study, the ZnO NPs significantly increased the serum zinc levels in the HD group compared to the Control and Vehicle groups within 48 hr after I.P. injection. This is consistent with the findings of L i et al 39. They showed that the I.P. injected ZnO NPs entered the circulation within 30 min and distributed mainly to the liver, spleen and kidneys in mice. The serum zinc levels surged within 6 hr of injection and remained at high levels for 48 hr.
Although zinc is an essential element for liver metabolism, excess zinc ions released from ZnO NPs are responsible for hepatocyte cell membrane damage and the subsequent release of AST, ALT, and ALP enzymes into the blood 41. So, our biochemical analysis indicated that the ZnO NPs significantly increased the serum levels of AST, ALT, and ALP enzymes in the HD group as compared to the Control and Vehicle. These results reflect the liver damage and support the findings of Kausar et al 42. They reported liver dysfunction in rats after I.P. administration of ZnO NPs (10-30 mg/kg) for 21 days. The liver injury was highlighted by increased serum levels of AST, ALT, and ALP. In addition, distinct hepatic pathological changes such as vascular congestion, infiltration of inflammatory cells, cytoplasmic vacuolization, and focal necrosis were observed 42. Similarly, our histopathological observations also illustrated mild hepatocyte ballooning degeneration with clear or vacuolated cytoplasm at low concentrations of ZnO (1 mg/kg/ml). Further increase of ZnO NPs dosage (5 mg/kg/ml) led to moderate hepatocytes ballooning degeneration, cytoplasmic vacuolation, and congestion of hepatic sinusoids. On the other hand, a high dose of ZnO NPs (10 mg/kg/ml) resulted in extensive ballooning degeneration of hepatocytes, mild focal (spotty) necrosis and blood congestion within the sinusoids. Although the underlying mechanism of hepatocyte enlargement was not determined in the current work, our morphometric analysis showed that hepatocyte area and perimeter were significantly increased in the MD and HD groups compared to the control. We suggest that there is a correlation between ballooning degeneration and increased perimeter and area of hepatocytes after administration of ZnO NPs.
Our findings are also in line with the study by Hong et al 43 which identified remarkable histopathological changes in the liver, kidney, lung, spleen and pancreas following I.P. administration of ZnO NPs in mice. Early apoptotic changes characterized by nuclear pyknosis were observed in the liver after daily I.P. injection of ZnO NPs for 7 days (1 and 10 mg/kg). Another study by Hegazy et al 44 found considerable liver histopathological changes including disruption of hepatic plate arrangement after daily I.P. injection of ZnO NPs (1 mg/kg/ml) for 5 days in rats. The ZnO NPs were accumulated within the liver and induced hepatocyte ballooning degeneration, cytoplasmic vacuolation, infiltration of inflammatory cells and congestion of hepatic sinusoids and central veins.
In summary, our findings indicated that exposure to ZnO NPs for 28 days results in hepatic histological and biochemical alterations with potential effects on the spatial arrangement of hepatocytes. The Voronoi tessellation was used in this investigation as a proven mathematical method that completes stereological evaluations. For the first time, we observed different spatial distributions of hepatocytes including random and cluster patterns following the administration of ZnO NPs. Nonetheless, the findings of the current study have to be seen in light of some limitations including: The Voronoi diagram nearly corresponds to epithelial cells with minimal intercellular substance. However, it does not correlate with the connective tissue with a large extracellular matrix 45. In the current study, we have exclusively assessed the changes in the spatial arrangement of hepatocytes using the CV. It is a dimensionless value that remains unchanged despite shrinkage, atrophy, or stretching of the section, but it is affected by cell loss 46. The CV reflected the disordered spatial arrangement of hepatic tissue after ZnO NPs administration. Further studies are required to establish a substantial correlation between the spatial arrangement of hepatocytes and their structure and function. Although the Voronoi method has some limitations, it can be utilized to depict the normal and pathological architecture of epithelial tissues.
Conclusion :
The present study showed that hepatocytes lost their regular spatial distribution after ZnO NPs administration for 28 days. Our histopathological and biochemical observations proved that the ZnO NPs induced liver injury and dysfunction. Moreover, we suggested that the hepatic pathological changes induced by ZnO NPs were the main reasons behind the alterations in the spatial distribution of hepatocytes in the rabbit liver. A strong correlation between hepatic spatial arrangement and toxicity of ZnO NPs should be further investigated.
Acknowledgement :
The authors would like to express their sincere gratitude to the Research Deputy of Shiraz University of Medical Sciences for offering grant number 18024. The current work was accomplished by Zia Moasses as a part of the requirements for PhD program. The authors would also like to thank Shiraz University of Medical Sciences, Shiraz, Iran. Thanks to Dr. Mohammad Reza Namavar, Mr. Saied Karbalay-doust, Dr. Houman Rouzbehi (for histopathological assistance) and Dr. Alireza Sadeghi (for statistical assistance). Technical support was also provided by Mr Izad Noori.
Conflict of Interest :
The authors declared no conflict of interest.
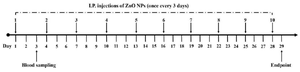
Figure 1. The study design, ZnO NPs administration, and blood sampling.
|
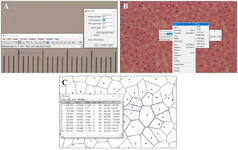
Figure 2. The Voronoi tesselation tutorial. Set scale button (A), Image button (B), and figure C shows how to measure the area, mean, and SD of each polygon.
|
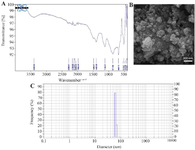
Figure 3. ZnO NPs characterization; FTIR spectroscopy (A), SEM observations (B), and DLS hydrodynamic size distribution (C).
|
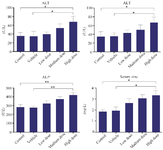
Figure 4. The effects of ZnO NPs on serum biochemical profiles in the rabbit. (AST): Aspartate aminotransferase, (ALT): Alanine aminotransferase, (ALP): Alkaline phosphatase and serum Zinc. Data were expressed as Mean±SD (n=5) and analyzed by the Kruskal-Wallis test followed by Dunn’s multiple comparison test (*p<0.05, ** p<0.01).
|
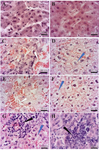
Figure 5. The effects of ZnO NPs on the histological features of rabbit liver. A) Control, B) Vehicle, C) Low Dose, D, E) Medium Dose, F-H) High Dose groups: The White arrows represent vascular blood congestion. The blue arrow shows ballooned hepatocytes. The black arrow indicates the focal area. Small groups of hepatocytes are degenerating and the area is mildly infiltrated by inflammatory cells. Magnification 100×.
|
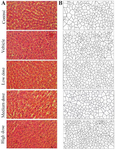
Figure 6. The Voronoi tessellation results. Representative photograph of polygon area (A), schematic images of Voronoi tessellation of the hepatocytes (B), H & E staining, 40×
|
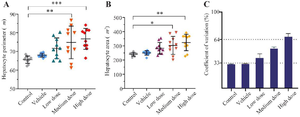
Figure 7. Comparison of the individual hepatocyte Perimeter (A), area (B) and coefficient of variation (CV) in different experimental groups. Data were expressed as Mean±SD (n=10) and analyzed by the Kruskal-Wallis test followed by Dunn’s multiple comparison test (*p<0.05, ** p<0.01, *** p<0.001).
|
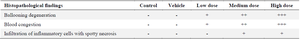
Table 1. Summary of histopathological changes of the rabbit liver after exposure to ZnO NPs
Key: Low Dose (1 mg/kg/ml ZnO NPs); Medium Dose (5 mg/kg/ml ZnO NPs); HD, High Dose (10 mg/kg/ml ZnO NPs). (+): Mild, (++): Moderate and (+++): Severe Changes.
|
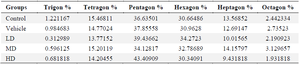
Table 2. The ratio of different polygonal shapes of the hepatocyte
LD, Low Dose (1 mg/kg/ml ZnO NPs); MD, Medium Dose (5 mg/kg/ml ZnO NPs); HD, High Dose (10 mg/kg/m. ZnO NPs).
|
|