Chimeric External Control to Quantify Cell Free DNA in Plasma Samples by Real Time PCR
-
Eini, Maryam
-
Department of Medical Biotechnology, Faculty of Paramedical Sciences, Shiraz University of Medical Sciences, Shiraz, Iran
-
Student Research Committee, Shiraz University of Medical Sciences, Shiraz, Iran
-
 Behzad-Behbahani, Abbas
Diagnostic Laboratory Sciences and Technology Research Center, School of Paramedical Sciences, Shiraz University of Medical Sciences, Tel: +98 71 32270301, E-mail: behzadba@sums.ac.ir, behzadba@gmail.com
Behzad-Behbahani, Abbas
Diagnostic Laboratory Sciences and Technology Research Center, School of Paramedical Sciences, Shiraz University of Medical Sciences, Tel: +98 71 32270301, E-mail: behzadba@sums.ac.ir, behzadba@gmail.com
-
Diagnostic Laboratory Sciences and Technology Research Center, School of Paramedical Sciences, Shiraz University of Medical Sciences, Shiraz, Iran
-
Takhshid, Mohammad Ali
-
Diagnostic Laboratory Sciences and Technology Research Center, School of Paramedical Sciences, Shiraz University of Medical Sciences, Shiraz, Iran
-
Ramezani, Amin
-
Department of Medical Biotechnology, Faculty of Advanced Medical Sciences and Technology, Shiraz University of Medical Sciences, Shiraz, Iran
-
Institute for Cancer Research, Shiraz University of Medical Sciences, Shiraz, Iran
-
Rafiei Dehbidi, Gholam Reza
-
Diagnostic Laboratory Sciences and Technology Research Center, School of Paramedical Sciences, Shiraz University of Medical Sciences, Shiraz, Iran
-
Okhovat, Mohammad Ali
-
Diagnostic Laboratory Sciences and Technology Research Center, School of Paramedical Sciences, Shiraz University of Medical Sciences, Shiraz, Iran
-
Farhadi, Ali
-
Diagnostic Laboratory Sciences and Technology Research Center, School of Paramedical Sciences, Shiraz University of Medical Sciences, Shiraz, Iran
-
Alavi, Parniyan
-
Diagnostic Laboratory Sciences and Technology Research Center, School of Paramedical Sciences, Shiraz University of Medical Sciences, Shiraz, Iran
Abstract: Background: DNA isolation procedure can significantly influence the quantification of DNA by real time PCR specially when cell free DNA (cfDNA) is the subject. To assess the extraction efficiency, linearity of the extraction yield, presence of co-purified inhibitors and to avoid problems with fragment size relevant to cfDNA, development of appropriate External DNA Control (EDC) is challenging. Using non-human chimeric nucleotide sequences, an EDC was developed for standardization of qPCR for monitoring stability of cfDNA concentration in blood samples over time.
Methods: A DNA fragment of 167 bp chimeric sequence of parvovirus B19 and pBHA designated as EDC fragment was designed. To determine the impact of different factors during DNA extraction processing on quantification of cfDNA, blood samples were collected from normal subjects and divided into aliquots with and without specific treatment. In time intervals, the plasma samples were isolated. The amplicon of 167 bp EDC fragment in final concentration of 1.1 pg/ 500 μl was added to each plasma sample and total DNA was extracted by an in house method. Relative and absolute quantification real time PCR was performed to quantify both EDC fragment and cfDNA in extracted samples.
Results: Comparison of real time PCR threshold cycle (Ct) for cfDNA fragment in tubes with and without specific treatment indicated a decrease in untreated tubes. In contrast, the threshold cycle was constant for EDC fragment in treated and untreated tubes, indicating the difference in Ct values of the cfDNA is because of specific treatments that were made on them.
Conclusions: Spiking of DNA fragment size relevant to cfDNA into the plasma sample can be useful to minimize the bias due to sample preparation and extraction processing. Therefore, it is highly recommended that standard external DNA control be employed for the extraction and quantification of cfDNA for accurate data analysis.
Introduction :
Recently, diagnostic aspects of cell free DNA (cfDNA) in plasma samples and its association with several diseases and disorders are emphasized 1. cfDNAs can be found in healthy individuals with nonmalignant diseases as well as in persons with various malignancies. Generally, conventional methods such as tissue biopsies, Computed Tomography (CT) scan and prenatal diagnostic tests like Chorionic Villus Sampling (CVS) and amniocentesis are the methods of choice for definite diagnosis of various diseases. However, in some cases these methods are invasive and even life-threatening. Alternative procedures for testing cfDNA in plasma that could eliminate the conventional methods would be safe and reliable candidates. However, for analyzing data and assessment of clinical status of the patients, determination of the original concentration of cfDNA in plasma sample is crucial. Also, the issues like the importance of quantification of cfDNA fragments in plasma sample as prognostic or diagnostic markers, as well as monitoring diseases such as cancer have been studied 2,3.
Cell free DNAs in blood circulation are heterogeneous in size of fragments and the concentration. They are only stable for few minutes in blood. Moreover, various factors during blood sampling and processing can affect the concentration of cfDNA 4-6. For this reason, the actual amount of cfDNAs will not be determined in the sample. Thus, selection of appropriate methods for isolation and quantification of plasma DNA is very important.
Real time PCR is the method of choice for absolute quantitation of cfDNA in plasma samples 7. However, the quality and the quantity of target sequence in samples is the major concern in all PCR based assays, especially in real time PCR DNA isolation procedure can significantly influence the quantification and qualification of DNA when cell free DNA (cfDNA) is the subject. To overcome this problem, application of appropriate standard external DNA control (EDC) would be reasonable. A variety of nucleic acid sequences have been used as external standard controls including plasmid DNA containing target sequence 8,9, PCR-amplicons 10 and commercially available DNA 11. Each has advantages and disadvantages in terms of complexity of the material, cost, accessibility, long-term stability and gene copy accuracy.
Extraction of low concentration of cfDNA in plasma sample of normal individuals (1.8-44 ng/ml) is challenging, although the concentration of cfDNA is increasing in diseases or during pregnancy 4. To assess the extraction efficiency, linearity of the extraction yield, presence of co-purified inhibitors and to avoid problems with fragment size relevant to cfDNA, an in house standard external control (approximately 167 bp) for quantification of cfDNA in plasma sample of a normal individual was developed in this study. Then, the developed method was applied for standardization of qPCR for monitoring stability of cfDNA concentration in blood samples over time.
Materials and Methods :
Sample preparation: Whole peripheral blood samples were collected from normal subjects by venipuncture and divided into separate K3EDTA Vacuette® tubes labeled (A) with and (B) without cell membrane stabilizer reagent. Each tube received 1.3 ml of blood samples. After 0, 3, and 6 days of incubation at room temperature, plasma samples were separated from whole blood by centrifugation once for 10 min at low speed (1000×g) and the resulting plasma sample was spun once more for 10 min at a higher speed (1600×g) in order to free plasma from any remaining blood cells. 500 µl of each plasma samples was carefully separated and transferred to sterile DNase free tubes for further use.
Construction of external DNA control (EDC) fragment: A 167 bp chimeric fragment was constructed which was derived from the unique region of structural protein (VP1) of parvovirus B19 cloned in pBHA vector and a sequence of the vector. To design highly specific and efficient primers, AlleleID software version 7.5 (Premier Biosoft, USA) was employed. The primer pairs were designed in such a manner that the forward primer binds specifically to the plasmid nucleotide sequence and the reverse primer binds to the virus part of the template (Table 1).
It was confirmed that the primer pair will specifically amplify the chimeric sequence by searching for the nucleotide sequences that contain both primer sequences on opposing strands in the NCBI GenBank database using BLAST (http://www.ncbi.nlm.nih.gov/BLAST).
Spiking of EDC fragment into the plasma samples: pBHA containing parvovirus B19 VP1 gene was used as a template for PCR amplification of 167 bp chimeric fragment using specific designed primers. Standard PCR reaction mixture contained 1×PCR reaction buffer, 1.5 mM MgCl2, 200 µM dNTPs, 2.5 units Taq-DNA polymerase, 0.5 µM of each primer and 10 ng template plasmid DNA in 25 µl total reaction volume. Thermocycling for PCR was one cycle at 95°C for 30 s for the initial denaturation followed by 30 s at 95°C, 30 s at 56°C and 30 s at 72°C for 40 cycles and a final extension for 10 min at 72°C. After agarose gel electrophoresis and ethidium bromide staining, the chimeric fragment was extracted from the gel using AccuPrep® Gel Purification Kit (Bioneer, Korea) according to the manufacturer’s instruction.
As an external DNA control, 1.1 pg (equal to 62.9x10⁵ copies) of the purified chimeric DNA fragment was added to 500 µl of plasma sample and subjected to DNA extraction method which had been developed for purification of cfDNA from plasma samples 12. DNA pellet was dissolved in 50 µl of sterile nuclease-free distilled water.
Primers and TaqMan probe for amplification of ACTB fragment: To investigate efficiency of sample preparation and integrity of the extracted cfDNA, AlleleID software version 7.5 was employed to design a set of primer pair and specific TaqMan probe for amplification and detection of a 414 bp fragment of human ACTB (actin, beta) as an endogenous fragment. Specificity of primers and probe was confirmed using BLAST search against NCBI database (http://www.ncbi.nlm.nih.gov/ BLAS) (Table 1).
Real time PCR
Preparation of standard curve for quantification of the external control fragment: To generate reliable standard curve for quantitative determinations of external control and to assess the amplification efficiency, 10-fold serial dilution (85-0.085 pg/µl equal to 32.7×10⁶- 32.7×10³ copies/µl) of the pBHA plasmid containing parvovirus B19 VP1 gene was prepared in sterile nuclease free distilled water.
Real time PCR assay for the EDC fragment: PCR was performed using the TaKaRa SYBR Premix Ex Taq II (TaKaRa, Japan) on Rotor-Gene Q (Qiagen, Hilden, Germany) in final volume of 20 μl. Each reaction contained 10 µl of TaKaRa master mix, 0.2 µM forward and reverse primers, 1/50 dilution of ROX reference dye (TaKaRa, Japan) and 5 µl of template DNA (425-o.425 pg/reaction equal to 16.35×10⁷-16.35×10⁴ copies/reaction). The reaction was initiated by activation of Taq polymerase at 95oC for 30 s, followed by 45 three-step amplification cycles consisting of 5 s denaturation at 95oC, 20 s annealing at 58oC and 30 s extension at 72oC. PCR efficiency (E) value was calculated by the analysis software Rotor-Gene Q Series Software Version 2.0.2 (Qiagen, Hilden, Germany).
Preparation of standard curve for absolute quantification of cfDNA: To construct standard curve for ACTB as the reference gene, PCR was performed on DNA extracted from a whole blood. Standard PCR reaction mixture contained 1×PCR buffer, 1.5 mM MgCl2, 200 µM dNTPs, 2.5 units Taq-DNA polymerase, 0.5 µM of each primer, and 50 ng template DNA in 25 µl total reaction volume. Thermocycling for PCR was one cycle at 95°C for 5 min for the initial denaturation followed by 30 s at 95°C, 30 s at 52°C and 45 s at 72°C for 40 cycles and a final extension for 10 min at 72°C. After agarose gel electrophoresis and ethidium bromide staining, the 414 bp fragment was extracted from the gel using AccuPrep® Gel Purification Kit (Bioneer, Korea) according to the manufacturer’s instruction. The purified PCR products were then cloned into the pTZ57R/T vector using Bioneer TA cloning kit (Bioneer, Korea) and used as template DNA to plot absolute standard curve.
To generate standard curve, 10-fold serial dilution (1.1-0.011 pg/µl equal to 30.9×10⁴-30.9×10² copies/µl) of the plasmid containing ACTB gene was prepared in sterile nucleus free distilled water.
Real time PCR assay for the ACTB: To generate the standard curve for ACTB, real time PCRs were performed using the TaKaRa TaqMan master mix; Premix Ex Taq (Probe qPCR) on Rotor-Gene Q (Qiagen, Hilden, Germany) in final volume of 20 μl. Each reaction contained 10 µl of Takara master mix, 0.3 µM of each forward and reverse primers, 0.2 µM FAM-BHQ specific probe, 1/50 dilution of ROX reference dye (TaKaRa, Japan) and 5 µl of template DNA (5.5-0.055 pg/reaction equal to 15.45×10⁵-15.45×10³ copies/reaction). The reaction was initiated by activation of Taq polymerase at 95oC for 30 s, followed by 40 three-step amplification cycles consisting of 5 s denaturation at 95oC, 20 s annealing at 52oC and 30 s extension at 72oC. PCR efficiency (E) value was calculated by the analysis software Rotor-Gene Q Series Software Version 2.0.2 (Qiagen, Hilden, Germany).
Evaluation of treated (A) and untreated (B) plasma samples: To assess the value of quantifiable external control and correct technical variation, real time PCRs were performed on overtime DNA extracted from treated (A) and untreated (B) plasma samples contained 1.1 pg of chimeric fragment. The assay was performed in four times to analyze the quantity of ACTB in the presence of external control.
Normalization of ACTB level by external control: Since the spiked external control was extracted in the same plasma sample as for ACTB, the relative quantification ratio of cfDNA level was calculated based on the following equation 13:
|
(E target) ΔCt target (control- sample) |
| Ratio (R) = |
|
|
(E reference) ΔCt reference (control- sample) |
E: Real-time PCR efficiencies, Target: ACTB, Ct: Threshold cycle, Control: Untreated sample at time 0, Sample: other tubes, Reference: EDC
The ratio shows differences between the quantities of the treated cfDNA fragments and the control samples after removing the factors affecting DNA concentration during extraction process. To determine the actual copy number of cfDNA, R is multiplied by the copy number of cfDNA in control tube.
Results :
Verification of external control and ACTB (cfDNA) fragment: In order to validate specificity of designed primers for the amplification of 167 bp fragment of the external control and 414 bp fragment of the ACTB, PCR was performed on plasmids containing fragments (Figure 1).
Standard curve and optimal concentration of external control: In order to determine the appropriate number of copies that can be accurately extracted by the method and to confirm that the target and the control were amplified with similar efficiency, real time PCR was performed on serial 10-fold dilutions of the pBHA plasmid containing parvovirus B19 VP1 gene in sterile nuclease-free distilled water (85-0.085 pg/µl equal to 32.7x10⁶-32.7x10³ copies/µl). An in house DNA extraction method specifically designed for extraction and purification of cfDNA in plasma samples was used. Based on the possible confounding factors during the extraction and Ct levels of the reactions after the extraction, the appropriate amount of the external control fragment for spiking into plasma samples that can be accurately extracted by the method was selected to be 1.1 pg (equal to 62.9x10⁵ copies) which was in the standard rang as well and added to 500 µl of plasma. The extracted DNA was then dissolved in 50 µl of sterile nuclease-free distilled water (Figure 2). The amplification efficiency of the external sequence was 100%.
Standard curve for cfDNA (ACTB) fragments: The standard quantification curve was generated using 10-fold serial dilution (1.1-0.011 pg/µl equal to 30.9×10⁴-30.9×10² copies/µl) of the plasmid containing ACTB gene in sterile nuclease-free distilled water. The slope for the ACTB standard curve was -3.31, corresponding to an efficiency of 100% (Figure 3).
Accuracy of quantification of ACTB in the presence of external control: The feasibility and efficacy of plasma cell free DNA extraction in the presence of a specific amount of the external control was also evaluated. The cfDNA (ACTB) concentration in harvested plasma from tubes with and without stabilizer reagent that stored at 22°C for 0, 3, and 6 days were measured together with the spiked external controls. The external control Ct values of both treated and untreated samples (with and without stabilizer) showed no change in DNA concentration (Figure 4). Whereas no significant changes were observed in cfDNA concentrations in tubes with treatment, some differences were determined in cfDNA (ACTB) levels in tubes with no treatment on days 3 and 6 (Figure 5). A significant increase in cfDNA level on days 3 and 6 compared to day 0 was demonstrated which, according to same Ct values of external DNA control fragment, was not related to the method of extraction but the lack of cell membrane stabilizer in tubes. As shown in figure 6, the absolute concentration of ACTB had not been affected by DNA extraction process; however, any changes can be associated with the presence or absence of stabilizer in the tubes.
Overall, results suggest a clear advantage in employing external DNA control by monitoring effectiveness of DNA extraction process and possible inhibition of quantitative real time PCR assay.
Discussion :
Recently, cell free DNA has been used as a potential biomarker for molecular diagnosis of various diseases such as maternal disorders and neoplastic diseases 14. The quantity of cfDNA is small in both healthy and diseased human plasma samples 15 with the higher levels in patients with cancer diseases 16. Therefore, sensitive and sophisticated techniques such as real time PCR should be employed for accurate detection.
There are many technical considerations that could cause a wide range of measurement differences. The impact of endogenous and exogenous factors in samples processed for the cfDNA extraction hampers the quantification of the resulting cfDNA in first step.
In this study, an in house standard External DNA Control (EDC) was developed to monitor the accurate quantification of cfDNA during extraction process. The effects of both incubation period of the samples at room temperature and presence or absence of nucleic acid stabilizer on the final quantity of cfDNA were also investigated.
Following proper sample collection, an efficient DNA extraction method should be used in order to provide appropriate DNA yield, eliminate inhibitors and maintain the highest quality. For these reasons, it is crucial to employ an external control to rule out inhibition and other errors during extraction procedure. In addition, the external control should nearly be the same as the cfDNA in relation to the fragment size and the lack of any sequence homology with human genome or other organisms.
It has been shown that normal plasma samples contained DNA fragments about 180 bp in size and in most cases the fragments are <500 bp 17. Considering the integrity of cfDNA fragment size, plasma samples of cancer patients contain fragments between 400 and 800 bp in size 17. In the current study, the size of external control fragment was equivalent to the fragment length of native cfDNA in normal plasma sample.
Using pBHA vector containing the unique region of structural protein (VP1) of parvovirus B19, a highly specific primer pair was designed for amplification of 167 bp fragment derived from sequence of parvovirus B19 and the vector. The 3’ end of forward primer was hybridized very well with the sequence of plasmid part of the external control while the reverse primer flanked with the virus sequence. Using this sort of chimeric external control would decrease the risk of cross reaction with other sequences of microorganisms, if any.
The total DNA levels in normal plasma samples were reported to be quite low (3.6-5.0 ng/ml) 17. Therefore, in our study, based on real time PCR, threshold cycle (Ct) levels of the reactions and the possible confounding factors during the extraction, the appropriate amount of the external control fragment for spiking into plasma samples was selected to be 1.1 pg /500 µl of plasma. Given that several preanalytical factors, like a delay in blood processing and storage temperature, have an influence on the DNA yield and to make analyzing the results more simple and accurate, the external controls should not be under any treatment. Therefore, to assign a measure of extraction efficiency, the external DNA controls were immediately added to the plasma samples prior to DNA extraction.
Even though commercially available kits have many advantages and drawbacks for cfDNA isolation, still there is no acceptable standard method 18. An in house modified DNA extraction method specifically designed for cfDNA in plasma sample was used in this study. This method of extraction was able to produce a DNA yield from plasma samples of healthy individuals four times higher than the commercial kits such as Maxwell® 16 LEV DNA Purification Kit, QIAamp® DNA Mini and Blood Mini Kit and NucleoSpin® Plasma XS8. Considering the fragment-length of the isolated cfDNA, the method was able to detect fragments from 100 pb up to 600 bp by PCR amplification 12. However, technical errors should not be ignored during extraction processing.
Because the technique of real-time PCR poses problems in various stages of sample preparation and processing, an appropriate normalization method should be used to achieve reliable results. In most cases, an internal control is used as a reference gene for the normalization of the results. However, in the present study, all the target genes were under treatment and therefore an internal reference gene for normalization of the target gene could not be used. Instead, an exogenous reference fragment was spiked to carry the same information about technical performance in general. The main drawback of this approach is the presence of the background nucleic acid sequence in the samples. To overcome this limitation, an external control was used with no sequence similarity with human or other micro-organism genomes.
To provide accurate and efficient results for the target DNA in the samples, the impact of the length and the concentration of the spiked DNA control should be considered as well. Purified 167 bp fragments of the external DNA control was spiked with the concentration of 1.1 pg/500 µl of plasma which is in range of cfDNA fragment length and concentration in plasma samples of normal individuals. As shown in figure 4, same Ct values were obtained when the same concentration of external control was spiked into the treated and untreated samples, incubated for 0, 3, and 6 days at room temperature.
In real time PCR, data normalization is crucial in gene quantification analysis. In this study, no significant changes were found in the patterns of Ct values of ACTB as the target gene in treated samples, while the decrease in Ct levels of untreated samples was noticeable. However, the accurate results were obtained when the external control as an independent variable was used for normalization of the target gene applying Pfaffl equation 13. Using external control makes it easy to exclude the factors affecting DNA concentration during extraction process and ultimately affects accurate real time PCR results.
Conclusion :
In conclusion, in this study, the value of an external control as a reference gene in conjunction with target gene during extraction of cfDNA from plasma samples of normal individuals was investigated. It was demonstrated how a spike-in containing fragment sizes relevant to cfDNA can be used to minimize bias due to sample preparation and extraction processing. Therefore, it is highly recommended that standard external DNA control should be employed for the extraction and quantification of cfDNA for accurate data analysis.
Acknowledgement :
This work is based on a thesis in Medical Biotechnology by Maryam Eini (Project No.93-7093), supported by Shiraz University of Medical Sciences, Shiraz, Iran.
Conflict of Interest :
The authors declare no conflict of interest.

Figure 1. A) PCR amplification of 167 bp EDC 1. 50 bp DNA ladder. 2. Negative control, 3. EDC, B) PCR amplification of 414 bp ACTB as an internal (cfDNA) control. 1. 100 bp DNA ladder, 2. Genomic DNA, 3. Plasmid DNA containing ACTB fragment.
|
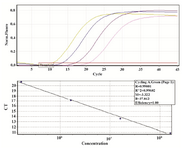
Figure 2. Standard curve, produced by the amplification of external control 1:10 dilutions (80-0.08 pg/µl equal to 32.7×10⁶-32.7×10³ copies/µl) of pBHA containing parvovirus B19 VP1 plasmid gene for 45 cycles. The amplification efficiency and R2 were 100% and 0.99, respectively (Threshold fluorescence: 0.03).
|
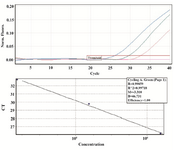
Figure 3. Standard curve, produced by the amplification of ACTB 1:10 dilutions (1.1-0.011 pg/µl equal to 30.9×10⁴-30.9×10² copies/µl) of plasmid DNA for 40 cycles. The amplification efficiency and R2 were 100% and 0.99, respectively (Threshold fluorescence: 0.01).
|
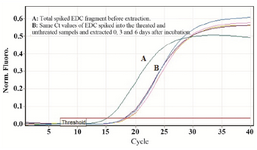
Figure 4. A) External DNA control (EDC) for monitoring PCR reaction inhibition. Results indicate that EDC gives almost the same Ct values for both treated and untreated samples showing no inhibition through DNA extraction process (Threshold fluorescence: 0.03).
|

Figure 5. A fragment of ACTB gene was amplified from human genomic DNA (cfDNA). No significant change was observed in the pattern of Ct levels of extracted DNA from treated samples, while the decrease in Ct levels of untreated samples is clear. A) Ct value of ACTB DNA extracted from untreated sample after 6 days of incubation. B) Ct value of ACTB DNA extracted from untreated sample after 3 days of incubation. C) Ct values of ACTB DNA extracted from treated samples on days 0, 3 and 6 (Threshold fluorescence: 0.01).
|
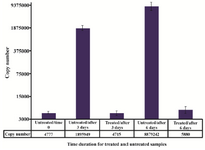
Figure 6. Absolute concentration of ACTB in extracted DNA from both treated and untreated plasma samples over time. Using external DNA control for the exclusion of factors affecting quality and quantity of DNA during extraction processing indicated that the alteration in ACTB copy numbers was not related to the method of extraction but treatments.
|
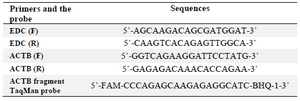
Table 1. Oligonucleotides primers and the probe used in this study
EDC: External DNA Control, F: Forward, R: Reverse
|
|