Use of Raman Spectroscopy to Decrease Time for Identifying the Species of Candida Growth in Cultures
-
 S. Chouthai, Nitin
Division of Neonatal-Perinatal Medicine, Wayne State University, Detroit, MI, United States of America, Tel: +313 745 5638, Email: nchoutha@med.wayne.edu
S. Chouthai, Nitin
Division of Neonatal-Perinatal Medicine, Wayne State University, Detroit, MI, United States of America, Tel: +313 745 5638, Email: nchoutha@med.wayne.edu
-
Division of Neonatal-Perinatal Medicine, Wayne State University , Detroit, MI, , United States of America
-
A. Shah , Anuj
-
Division of Neonatal-Perinatal Medicine, Wayne State University, Detroit, MI, United States of America
-
Salimnia, Hossein
-
Division of Pathology, Wayne State University, Detroit, MI, United States of America
-
Palyvoda , Olena
-
Lumigen Instrument Center, Wayne State University, Detroit, MI, United States of America
-
Devpura , Suneetha
-
Department of Radiation Oncology, Henry Ford Health System, Detroit MI, United States of America
-
Klein , Michael
-
Pediatric Surgery, Wayne State University , Detroit, MI, United States of America
-
Asmar , Basim
-
Division of Pediatric Infectious Diseases, Wayne State University , Detroit, MI, United States of America
Abstract: Background: The objective of this study is to establish Raman signatures from pure cultures of different Candida species using Raman Spectroscopy (RS) and use these signatures for rapid identification of unknown Candida species.
Methods: Pure cultures of five Candida species were evaluated using RS to build a limited signature library. ‘Raman Processing’ (RP) software was used for Principal Component Analysis (PCA) and Differential Functional Analysis (DFA).
Results: Eleven principal components described at least 95% variance in the spectra. Raman signatures from these known Candida species were able to identify the species of unknown Candida cultures with 100% accuracy.
Conclusion: Raman spectroscopy can improve early identification of Candida species and may facilitate early optimal antifungal therapy.
Introduction :
Late-onset sepsis occurs in 2-20% of extremely low birth weight neonates and up to 12% of these infections are due to candida species 1. Furthermore, candida Blood Stream Infections (BSIs) are associated with a 25-40% mortality rate 2. Invasive candida infections have also been associated with a 73% rate of neurodevelopmental impairment or death 3. Currently, identification of yeasts grown in a blood culture takes 24-48 hr which may delay appropriate antifungal therapy 4,5.
Raman Spectroscopy (RS) has been used to identify many characteristics of individual cell types including cancer tissue and stem cell types 6-8. RS measures the scattering of light by substances that have been excited through molecular vibrations within the compound 9,10. These molecular fingerprints can be used for qualitative identification of different compounds. It can potentially be used to create specific signatures for microorganisms like bacteria or fungi 11. Creating a reference library of specific signatures of clinically important pathogens may allow the use of spectroscopy as a tool for rapid identification of pathogens in clinical practice.
Candida albicans (C. albicans) and Candida parapsilosis (C. parapsilosis) are the most common agents that cause fungal BSIs in neonates 12. In addition, the incidence of Candida glabrata (C. glabrata) and Candida krusei (C. krusei) infections has increased due to increased use of fluconazole, to which these organisms are resistant 12,13. A small percentage of fungal BSIs are also caused by Candida tropicalis (C. tropicalis) 12. The objective of this study was to establish signatures of C. albicans, C. parapsilosis, C. glabrata, C. krusei and C. tropicalis that have been grown on Sabouraud Dextrose Agar (SDA) using RS. A second objective was to determine if these signatures can be used to identify unknown candida isolates.
Materials and Methods :
Colonies from five commonly occurring candida species grown on SDA media were evaluated. Candida species were obtained from American Type Culture Collection (C. albicans: ATCC 28815, C. parapsilosis: ATCC 34136, C. glabrata: ATCC 2001, C. krusei: ATCC 6258 and C. tropicalis: ATCC 13803). The identities of the samples were confirmed using API 20C identification system. All culture plates were inoculated using standard techniques of equal amount of inoculum and incubated for 24 hr. The plates with growth of fungi were directly placed under the Raman spectroscope without additional processing. All spectral measurements (C. albicans: 115 spectra, C. parapsilosis: 112 spectra, C. glabrata: 108 spectra, C. krusei: 117 spectra, C. tropicalis: 128 spectra from five SDA plates each and Unknown: 90 spectra from nine SDA plates) were obtained from 20-25 different points on each sample’s area of interest using Renishaw Wire 2.0 software.
Raman measurements were acquired using a Renishaw InVia Raman microscope (Renishaw, Gloucestershire, United Kingdom) by a 785 nm (infrared, IR) excitation laser with 50×objective. A single-grating spectrograph with a 1200 line/mm grating combined with a holographic notch filter for Rayleigh scattering rejection were used. A 50´ objective lens was used to focus the excitation laser beam to a spot size of ∼4 µm×30 µm on a single colony on the SDA medium. Once the laser was initiated, collection of the back-scattered light took place with the laser power set at 100% (3 mW). Each spectrum consisted of the average of 2 collections with a 10 s collection time and an extended range of 600 to 1800 cm-1. Measurements were obtained using Renishaw Wire 2.0 software. At least 20 spectra were measured from different randomly selected points on each sample. The Raman Processing Software (RP Software) was used to import and analyze the data 14. The acquired raw spectra were corrected by subtracting background fluorescence, reducing noise, and normalizing the intensities. Data were analyzed using Principal Component Analysis (PCA) and Discriminant Function Analysis (DFA). The peaks in Raman spectra (wavenumbers) that were most significant to the classification process were identified. The biochemical correlates of these Raman peaks were also described using previously published work 15,16.
A data bank or library of different Raman signatures for each of the five candida species was created. Unknown colonies of candida species were also derived using ATCC reference species (C. albicans, C. parapsilosis, C. glabrata, C. krusei and C. tropicalis) after creating the initial library databank. The investigating team was blinded to the identity of the unknown candida species. Colonies from cultures of unknown candida species, derived from sources other than those that were used to create the library, were compared with the known Raman signatures to identify their species.
Results :
When processed with RP Software, five candida species examined showed eleven principal components generated by PCA, which account for 95.2 percent of the variance. Then the principal components were fed into DFA classifier, which enabled categorizing of unknown species. Figure 1 represents the mean normalized curves for each species and demonstrates the key differentiators among them. The chemical structure of the fungal elements represents different peaks within the Raman spectra. Based on the known spectra, the trained DFA classifier was able to identify unknown sample signatures with 100% accuracy. These differentiating peaks for different biological molecules have already been described 15,16. The Raman shift regions (wavenumbers/cm-1) associated with significant peaks within the Raman spectra and corresponding biochemical elements are described in table 1. The Raman signatures for all the unknown species evaluated were compiled and placed together in figure 2. This figure again demonstrates key differences among the unknown samples. Figure 3A represents two dimensional graphical representation of Principal Component 1 and Principal Component 2, thus demonstrates first step of PCA. Similarly Figure 3B demonstrates two dimensional graphical representation of first step of DFA.
Discussion :
In very low birth weight neonates with fungal BSIs, it is difficult at times to obtain blood samples for cultures and the amount of blood collected is sometimes suboptimal. This limits the sensitivity of blood cultures and some neonates with candida infections might go undiagnosed until an autopsy is performed 17. There are some non-culture methods for candida identification including testing for fungal antigens and DNA available either commercially or in the evaluation phase 13,18. Use of DNA technology for detection of candida has shown promise 13. In very low birth weight neonates, however, the detection of fungal BSIs using DNA technology is not superior to fungal lysis-centrifugation isolator system 19. The DNA technology would need use of costly reagents and technical expertise. The use of RS did not include use of any consumables and evaluation could be completed within 30 min per unknown sample.
This study is the first to demonstrate the use of RS for identification of candida species recovered in cultures. After colonies grow on solid culture media, it takes approximately 48-72 hr to identify the candida species 20. The API 20C identification system used as a standard of practice involves carbohydrate assimilation by fungal colonies. RS involves identification of peaks of chemical elements followed by comparing those using PCA and DFA techniques.
Conclusion :
RS is likely to reduce the identification time to only a few minutes, since Raman signatures were useful in identifying the unknown candida species with 100% percent confidence. This would be a significant advantage for very low birth weight neonates since they have limited ability to fight the invasive fungal infections. RS appears to be useful in decreasing time of identification of specific candida species after the organism has grown from a positive culture. Further studies are needed to explore the possibility of using Raman signatures for identification of organisms directly from clinical specimens.
Acknowledgement :
We acknowledge that the input is provided by Marilynn Faifax, MD, PhD (Department of Pathology, Wayne State University), Marko Jovanovski (General Surgery, Wayne State University), and Luke Reisner, PhD (Electrical and Computer Engineering, Wayne State University).
Financial Support :
No financial support was received for the study.
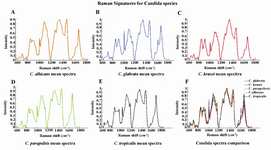
Figure 1. Mean normalized curves of the Raman signatures of the five candida species represented individually as well as compiled together.
|
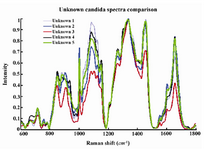
Figure 2. Compiled mean normalized curves of Raman signatures of unknown candida species.
|
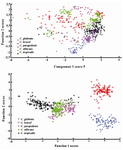
Figure 3. Two dimensional graphical representation of Principal Component Analysis (3A) and Differential Function Analysis (3B).
|
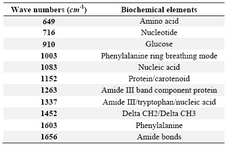
Table 1. Wavenumbers of significant peaks in Raman spectra and corresponding biochemical elements
|
|