Bryostatin-1, Fenretinide and 1α,25 (OH)2D3 Induce Growth Inhibition, Apoptosis and Differentiation in T and B Cell-Derived Acute Lymphoblastic Leukemia Cell Lines (CCRF-CEM and Nalm-6)
-
 M. Ardekani, Ali
Reproductive Biotechnology Research Center, Avicenna Research Institute, ACECR, Tehran, Iran, Tel: +98 21 22432020 Fax: +98 21 22432021 E-mail: Ardekani@avicenna.ac.ir
M. Ardekani, Ali
Reproductive Biotechnology Research Center, Avicenna Research Institute, ACECR, Tehran, Iran, Tel: +98 21 22432020 Fax: +98 21 22432021 E-mail: Ardekani@avicenna.ac.ir
-
Reproductive Biotechnology Research Center, Avicenna Research Institute, ACECR, Tehran, Iran
-
Jeddi-Tehrani, Mahmood
-
Monoclonal Antibody Research Center, Avicenna Research Institute, ACECR, Tehran, Iran
-
Ghahremanzade, Ramin
-
Nanotechnology Research Center, Avicenna Research Institute, ACECR, Tehran, Iran
Abstract: In many acute leukemias, normal differentiation does not occur. However, in many cell lines derived from hematologic malignancies, differentiation or apoptosis can be induced by variety of agents. Despite advances in the treatment of Acute Lymphoblastic Leukemia (ALL), in most patients long-term survival rates remain unsatisfactory, especially in T-cell derived ALL. Thus we studied the anti-cancer effects of fenretinide, 1α,25(OH)2D3, and bryostatin-1 in CCRF-CEM (T-cell derived) and Nalm-6 (B-cell derived) ALL cell lines. Using MTT assays, both cell lines were shown to exhibit increased inhibition of proliferation at micro (fenretinide) and nanomolar (1α,25(OH)2D3, bryostatin-1) concentrations. These anti-cancer agents were shown to induce apoptosis and activate caspase-3 pathway in both ALL cell lines. Furthermore, for the first time we are reporting consistent anti-proliferative and apoptotic effects of Bryostatin-1 in ALL T-cell derived cell line with the lowest ED50 (ranging 4.6 nM - 7.4 nM). To evaluate the differentiation induction by fenretinide, 1α,25(OH)2D3, and bryostatin-1 in ALL cell lines, we assayed for the expressions of CD19, CD38 markers on Nalm-6 and CD7 marker on CCRF-CEM cell line. The flow cytometric analysis showed a significant increase in expression of CD markers in response to anticancer drug treatments. To assay the effects of anti-cancer drugs on cell cycle distribution, cell cycle analysis using flow cytometry was employed. These anti-cancer drugs appear to affect the CCRF-CEM and Nalm-6 cell cycles differently (G0/G1 and G2/M, respectively). Overall results demonstrate that the anticancer agents used in this study are strong inhibitors of ALL cell proliferation and inducers of apoptosis and differentiation in vitro. These findings may be quite helpful if these drugs are to be used for differentiation therapy of ALL patients in clinics in the future. Further studies are warranted to establish the in vivo effect of these drugs particularly in patients with T-cell derived ALL.
Introduction :
Acute Lymphoblastic Leukemia (ALL) is a clonal hematopoietic malignancy that is characterized by abnormal proliferation of hematopoietic progenitor cells. Despite advances in the treatment of ALL, in most patients long-term survival rates remain unsatisfactory especially in ALL with T-cell origin (1,2). Hence, there is a continued need to discover new agents that may help and change the outcome for these patients. There are an increasing number of chemotherapeutic and biological agents that target several characteristics of cells such as differentiation, angiogenesis, proliferation, DNA repair, and apoptosis (2,3).
Over the recent years, it has been demonstrated that retinoids regulate biological processes including cell proliferation, differentiation, and apoptosis (4). Currently, retinoids are used in clinical trials of Acute Promyelocytic Leukemia (APL) and T-cell lymphoma (5-7). Since retinoid therapy is often associated with side-effects (skin irritation and liver toxicity), its amide derivatives (retinamides) have been investigated in adult and childhood cancers (7, 8). Among several retinamides examined, N-(4-hydroxyphenyl) retinamide (4-HPR, fenretinide) is considered a superior anticancer agent due to its favorable pharmacokinetic profile (9-11). 4-HPR has been used successfully for treatment of AML patients (5-7).
Also, many studies have demonstrated that the physiologically active metabolite of vitamin D, 1α,25(OH)2D3, inhibits the proliferation and promotes the differentiation of several cancerous cells (12-17). Anti-cancer properties of 1α,25(OH)2D3 have led to its evaluation in the treatment of hyper-proliferative malignancies (18-20). 1α,25(OH)2D3 apply its biological effects through a class of nuclear receptor, Vitamin D Receptor (VDR) (21). Formation of the ligand-receptor complex initiates the transcription of specific responsive genes resulting in the synthesis of appropriate proteins and modulation of cellular functions (22,23).
Another chemotherapeutic agent is Bryostatin-1(Bryo-1) which is a macrocyclic lactone isolated from the marine bryozoan Bugula neritina. It is an activator of the serine-threonine kinase PKC, an enzyme involved in diverse cellular processes including cell proliferation, differentiation, and stimulus–response coupling (24,25). Bryostatin-1 has been shown to potently inhibit the growth and self-renewal capacity of human leukemia cells at nanomolar concentrations in vivo and in vitro (26-28).
Although the effects of anti-cancer compounds (4-HPR, 1α,25(OH)2D3, Bryostatin-1) have been examined in various leukemias, little information is available on the effects of these anti-cancer compounds in T-cell and B-cell derived ALL cell lines. In the present study, we examine inhibition of cell proliferation and induction of both apoptosis and differentiation in two acute lymphoblastic leukemia cell lines (CCERF-CEM and Nalm-6) exposed to 4-HPR, 1α,25(OH)2D3, or Bryostatin-1.
We provide evidence that Bryostatin-1 induce growth inhibition and apoptosis at nanomolar range consistently in T-cell derived human ALL cell line.
Materials and Methods :
Leukemia cell lines
The ALL cell lines (CCRF-CEM, Nalm-6) were purchased from cell bank (Pasteur Institute Iran, Tehran). CCRF-CEM and Nalm-6 are derived from T and B lymphocytes, respectively. Human leukemic cell lines were grown in RPMI 1640 culture medium (GIBCO, Grand Island, NY) supplemented with 10% Fetal Bovine Serum (FBS, Gibco, Invitrogen, South America), 1% glutamine, 1% antibiotics (penicillin-streptomycin), and 1% nonessential amino acids. Cells were maintained at 37ºC and 5% CO2.
Reagents and treatments
Fenretinide (4-HPR), 1α,25(OH)2D3 (vitamin D3), and Bryostatin-1 (Bryo-1) were purchased from Sigma-Aldrich®, Steibeim, Germany. All anti-cancer compounds were dissolved in 100% ethanol. Stock preparations of 4-HPR and Bryostatin-1 were stored at
-20°C; however stock preparation of 1α,25(OH)2D3 was stored at -70°C. All reagents were diluted to appropriate final concentrations in medium (RPMI 1640). Final concentrations of ethanol never exceeded 0.01% (levels known to be without effect on the response of ALL cells to these compounds (13). Leukemic cells were washed twice in RPMI 1640 by centrifugation at 300×g for 5 min. Then, cells were suspended in medium with different concentrations of 4-HPR, 1α,25(OH)2D3, and Bryostatin-1. The cells were incubated for 24, 48, and 72 hr at 37 °C in a humidified 5% CO2 atmosphere. To examine the combinatory effects of 4-HPR and 1α,25(OH)2D3, leukemia cells were seeded at 2 × 10⁵ cells/ml in 24-well plastic plates and pre-treated with 0.1 or 1 nM 1α,25(OH)2D3 for 8, 24 or 48 hr before assays.
MTT assay
Cell proliferation was evaluated by the MTT (3, (4,5-dimethylthiazol-2-yl)-5-(3-carboxymethoxyphenyl–2(4-sulfophenyl)-2H-tetrazolium) (Sigma-Aldrich®, Steibeim, Germany) assay (29). Briefly, 5 ×10⁴ cells were plated in a total volume of 100 μl in 96-well plates (FALCON, USA) and suspended in medium with different concentration of 4-HPR, 1α,25(OH)2D3, and Bryostatin-1(Bryo-1). MTT was dissolved in absolute ethanol. Following 24, 48, and 72 hr incubation, 0.01 ml of MTT solution (at a final concentration 0.5 mg/ml) was added per well. The plates were then incubated for additional 3 hr. Then 100 μl of stop solution (isopropanol containing 0.04% HCl) was added per well. Immediately after solving the blue formazon crystals, the absorbance of samples was read using a 96-well plate reader (Anthos 2020) at 570 and 630 nm wave lengths. Results reported in this article are the mean±S.E.M. of three independently performed experiments, and each concentration was tested in eight wells per experiment. The results were considered to be significant when the p-value was <0.05, and highly significant when the p-value was <0.01 or <0.001.
Flow cytometric analysis of cell cycle
The DNA content during cell cycle steps were evaluated with flow cytometry. In brief, 5×10⁶ cells were treated with drugs at a specific concentration. After 24 hr, the cell pellets were washed and resuspended in 2 ml of 1% paraformaldehyde in PBS and incubated for 15 min at 4 °C. Then, cells were centrifuged and 1 ml of cold perm buffer III (BD.Co, USA) solution was added; cells were incubated for 30 min at 4 °C and then were washed twice in PBS. Next, 500 λ of PI (Sigma-Aldrich®, Steinbeim, Germany) staining buffer (50 μg/ml PI, 10 μg/ml RNase in PBS) was added and incubated for 1 hr at room temperature in the dark. After DNA staining by Propidium Iodide (PI), samples were evaluated by a flow cytometer using Partec FloMax software (Version 2.3) (29).
Flow cytometric analysis of apoptosis
In this study, 1×10⁶ cells/ml suspension of ALL cell lines was induced for apoptosis by addition of several concentrations of drugs. 1x10⁶ cells/ml suspension of non-induced leukemic cells was established as a negative control. Both control and experimental leukemic cell samples were incubated for 24 and 48 hr in a 37 °C, 5% CO2 incubator. Following incubation, cells were washed twice with DPBS (Dulbecco's Phosphate Buffered Saline). After that, the cells at concentration of about 1×10⁶ cells/ml were resuspended in 1X binding buffer (100 mM HEPES/NaOH, pH 7.5 containing 1.4 M NaCl and 25 mM CaCl2). Five hundred λ of the apoptotic cell suspension was added to a plastic 12 x 75 mm test tube, and 500 λ of the non-induced cell suspension was added to a second plastic tube. Next, 5 λ of AnnexinV-FITC (Sigma-Aldrich®, Steibeim, Germany) and 10 λ of Propidium Iodide (PI) (Sigma-Aldrich®, Steibeim, Germany) were added to each cell suspension. Then the tubes were incubated at room temperature for exactly 10 min and protected from light. Finally, fluorescence of the cells was immediately determined by a flow cytometer (29).
In order to adjust the flow cytometer for evaluating the apoptosis, a positive and a negative control sample was used. As a positive control, apoptosis was induced in a 1×10⁶ cells/ml suspension of leukemic cells by addition of 1 µg/ml Staurosporine (Sigma-Aldrich®, Steibeim, Germany). Flow cytometry analysis was performed using Partec FloMax software (Version 2.3).
Flow cytometric analysis of differentiation
The ALL cell lines were analyzed for phenotypic evidence of differentiation by examining the expression of cell surface antigens as described previously (30,31). Briefly, CCRF-CEM and Nalm-6 cells were washed with PBS supplemented with 1% FBS and stained with the following antibodies for 30 min at 4ºC: R-phycoerythrin (RPE)-conjugated mouse anti-human CD19 IgG1, R-phycoerythrin (RPE)-conjugated mouse anti-human CD38 IgG1, or fluorescein isothiocyanate (FITC)-conjugated mouse anti-human CD7 IgG2b (DakoCytomation, DAKO. Denmark). Specifically, CCRF-CEM cells were stained with FITC-conjugated mouse anti-human CD7 IgG2b and Nalm-6 cells were stained with RPE-conjugated mouse anti-human CD19 IgG1 or RPE-conjugated mouse anti-human CD38 IgG1. Cells were then washed to remove unbound antibody, resuspended in 0.5 ml PBS containing 1% FBS for immediate analysis with a minimum acquisition of 2×10⁴ events. Samples were run on a Partec FloMax flow cytometer. Results are presented as the relative mean fluorescence after subtracting the isotype control for each sample compared to the untreated media controls.
Western immunoblot analysis
Cell lysates (from 6×10⁶ cells) were assayed for protein concentration with the BCA Protein Assay Reagent kit (Thermo scientific, U.S.A). Sodium Dodecyl Sulfate-Polyacrylamide Gel Electrophoresis (SDS-PAGE) analysis was performed as previously described (32,33). Proteins were resolved on a 12% SDS polyacrylamide gel, transferred to a PVDF membrane (Roche, Germany). After transferring to PVDF membrane and blocking the non-specific binding sites with 5% skim milk, the membrane was incubated with the human reactive monoclonal anti-caspase-3 (abcam, Mediqip, United States) for 2 hr followed by incubation with the secondary rabbit anti-mouse horseradish peroxidase-labeled antibody (1:1000) for one hr. Bound antibody was detected with the ECL Western Blotting Detection System (GE healthcare, U.K). The chemiluminescence of the membranes was detected by exposure to X-ray film (Kodak, Rochester, NY). Hybridization with the house-keeping protein β-Actin was used as a control for equal loading and protein quality.
Statistical analysis
Statistical analyses were carried out using SPSS software (PASW 18, an IBM Company, Iran). Data are expressed as the mean±S.E.M. and comparison between the controls and each treatment group was performed using a two-tailed, paired student’s t-test. The results were considered to be significant when the p-value was <0.05, and highly significant when the p-value was <0.01 or <0.001.
Results :
Effects of anti-cancer compounds on proliferation in ALL cell lines
Recently, we have shown that 4-HPR can prevent the growth and proliferation of an AML cell line (NB-4) (34). In the present study, to determine the growth inhibitory effect of 4-HPR on two acute lymphoblastic leukemia cell lines (CCRF-CEM, and Nalm-6), both cell types were exposed to increasing concentrations of 4-HPR (1, 2.5, 5, 7.5, and 10 µM) and cell viability was determined by MTT assay. Eight samples were tested for each drug concentration and each experiment was repeated three times before MTT analysis. Results are represented in figure 1. 4-HPR inhibits the growth of ALL cell lines in a concentration-dependent manner (Figure 1A) and the most inhibitory effects were observed in Nalm-6 cells at low micromolar (µM) range after 72 hr. Overall, the results indicate that Nalm-6 cells relative to CCRF-CEM cells are more sensitive to fenretinide treatment.
1α,25(OH)2D3 was another compound investigated in the present study. Based on previous studies (13,35), concentrations in the nanomolar range were chosen to treat the cell lines (0.1, 10, and 100 nM). In figure 1B, effect of 1α,25(OH)2D3 on growth of CCRF-CEM and Nalm-6 cell lines is demonstrated. The maximum concentration used in this study (100 nM) revealed the highest inhibitory effects on growth of both leukemic cell lines. In Nalm-6 cells, 1α,25(OH)2D3 induced 73% inhibition at 100 nM, 48 hr post treatment. Nalm-6 cell line was more sensitive to 1α,25(OH)2D3 treatment relative to CCRF-CEM.
The third anticancer drug chosen to determine its growth inhibitory effects on ALL cells was Bryostatin-1. Although the concentrations of Bryostatin-1 used in this study were in the low nanomolar (nM) range, the results indicate a significant decrease in the survival of two leukemic cell lines. For instance, as shown in the figure 1C, Bryostatin-1, at concentration 10 nM, inhibits proliferation of CCRF-CEM and Nalm-6 cells by 63.03% and 60.25%, respectively (48 hr post treatment).
To show the effective dose of each anti-cancer drug that inhibited 50% growth (ED50) of ALL cells after 24, 48, and 72 hr treatment, ED50 was determined by plotting the inhibition of cell proliferation in the presence of increasing concentration of 4-HPR (1-10 µM), VD3 (0.1-100 nM), and Bryostatin-1 (0.1-10 nM) (Table 1). Comparing the ED50s among the three drugs, 4-HPR potently inhibited the growth of CCRF-CEM and Nalm-6 cells (ED50 ranging from 4.6 to 7.2 µM); however, it is clear that Bryostatin-1 has the lowest and clinically acceptable ED50 in lymphoblastic leukemia cell lines (24,28).
Because previous studies demonstrated the cooperative action of retinoic acid derivatives and 1α,25(OH)2D3 in various cancer cells (36,37), we next examined the synergistic effects of 4-HPR and 1α,25(OH)2D3 on proliferation inhibition in acute lymphoblastic leukemia cell lines (CCRF-CEM and Nalm-6) using MTT assay. Figures 1D and 1E respectively show that combination of low concentrations of 4-HPR (1 and 2.5 µM) and 1α,25(OH)2D3 (0.1 and 1 nM) can significantly reduce viability of ALL cells (up to 80%).
Flow cytometric analysis of cell cycle
To investigate the mechanisms by which 4-HPR, 1α,25(OH)2D3, and Bryostatin-1 inhibited the growth of ALL cell lines, the cell cycle distribution was analyzed after exposure of these cells to the anticancer drugs. As shown in table 2, the untreated CCRF-CEM cells (T-ALL) were mainly in G2/M phase (51.61%), and with the treatment of 5 µM 4-HPR and 100 nM 1α,25(OH)2D3 for 24 hr, the percentage of S phase cells were significantly decreased and those of G2/M phase cells were correspondingly increased (65.6% and 63.22% respectively). In contrast, treatment of CCRF-CEM cells with Bryostatin-1 (10 nM, 24 hr) significantly decreased the fraction of G2/M cells (26.83%) and increased the fraction of G0/G1 cells (46.8% compare to control 29.54%). Table 2 shows that untreated Nalm-6 cells (B-ALL) were mostly in G0/G1 (65.35%). When treated with 4-HPR (5 µM), 1α,25(OH)2D3 (100 nM), and Bryostatin-1 (10 nM), B-ALL cells were markedly accumulated in G0/G1 phase (86.42%, 76.1%, and 89.6%, respectively). Figure 2 is a representative flow cytometric chart of effects of anti-cancer drugs on cell cycle distribution in acute lymphoblastic leukemia cells.
Flow cytometric analysis of apoptosis
Next we examined the involvement of apoptotic cell death in reduced survival of CCRF-CEM and Nalm-6 cells in response to three anticancer drugs. For this purpose, Annexin V staining and flow cytometric analysis was utilized. The apoptosis sensitivities of the investigated cell lines were looked at in three groups of 4-HPR-treated, 1α,25(OH)2D3-treated, and Bryostatin-1-treated cells (Tables 3A, 3B, and 3C). In table 3A, CCRF-CEM and Nalm-6 cells treated by 4-HPR demonstrate an increase in apoptosis as the concentrations change. Table 3B shows that at higher concentrations of 1α,25(OH)2D3, CCRF-CEM cells were more responsive than Nalm-6 cells in 48 hr treatment group. As results in table 3C show, exposure of CCRF-CEM and Nalm-6 cells to Bryostatin-1 (24 hr and 48 hr) increased the population of cells being positive for annexin V (4.5-12.11%).
Next we evaluated the synergistic effects of 4-HPR and 1α,25(OH)2D3 on apoptosis induction in ALL cell lines. Table 3D shows that combination of 4-HPR and 1α,25(OH)2D3 increase the fraction of ALL cells undergoing apoptosis 24 and 48 hr post treatment when compared to individual treatments. Figure 3 is a representative flow cytometric chart of induction of apoptosis by anti-cancer drugs in acute lymphoblastic leukemia cells.
Flow cytometric analysis of differentiation
In recent years, many studies have been reported on the AML differentiation and differentiation induction by anticancer drugs (30,31,38). However, very few studies on differentiation induction in ALL cells are available (39-41). Several investigations have shown that B-cell differentiation is correlated with an up-regulation of both CD19 and CD38 expressions (42-44). In this study, we examined the potential capacity of 4-HPR, 1α,25(OH)2D3, and Bryostatin-1 for differentiation induction in B-ALL (Nalm-6) cells. Figures 4A and 4B show that treatments by three anti-cancer drugs strongly induce up-regulation of CD19 and CD38 in Nalm-6 cells.
To examine differentiation induction in CCRF-CEM (T-ALL) cells, we evaluated the presence of CD7 expression on these cells before and after treatment with three anti cancer compounds. We showed that all three anticancer drugs significantly increased CD7 expression in CCRF-CEM cell line (Figure 4C). A representative flow cytometric chart of these experiments is shown in figure 5.
Effects of anti-cancer compounds on caspase-3 activity in ALL cell lines
Since all three anti-cancer compounds (fenretinide, 1α,25(OH)2D3, and Bryostatin-1) induce apoptotic cell death in CCRF-CEM and Nalm-6 cell lines, we evaluated the mechanism by which these anti-cancer drugs act. Activation of caspase-3, a key enzyme involved in apoptotic cell death, was examined in ALL cell lines treated by drugs for 24 hr using Western blotting. Caspase-3 activity was observed in ALL cells when compared to control cells (ALL cells without treatment) suggesting that caspase-3 is activated in ALL cells treated with 4-HPR, 1α,25(OH)2D3, and Bryostatin-1 (Figure 6). We monitored uniform expression of β-Actin as a loading control.
Discussion :
In many acute leukemias differentiation, terminal cell division or programmed cell death can be induced by variety of agents. Therefore, regulatory pathways involved in hematopoietic differentiation can be reactivated in hematopoietic malignant cells with an appropriate stimulation (3). In this study, we selected three anti-cancer compounds (4-HPR, 1α,25(OH)2D3, Bryostatin-1) to examine their differentiation induction, anti-proliferative, and apoptotic effects in an in vitro model using two ALL cell lines.
In agreement with previous investigations (13,45-51), the results from present study demonstrate the anti-cancer effects of 4-HPR, 1α,25(OH)2D3, and Bryostatin-1 on both leukemic cell lines; although, the effects varied. 4-HPR decreased the proliferation of leukemic cells in a time and concentration manner and showed the most inhibitory effect in Nalm-6 cell line (B-cell derived) among the three anti-cancer drugs (Figure 1A). Similarly, previous studies have shown that Nalm-6 cell line to be effectively inhibited by 4-HPR (29,52). However, in our study, Bryostatin-1 is clearly demonstrated to be the compound with most consistent and significant anti-proliferative effects in CCRF-CEM cells (T-cell derived). Furthermore, it has the lowest and clinically acceptable ED50 in lymphoblastic leukemia cells (Table 1).
In preclinical studies, Bryostatin-1 has shown activity against diverse tumor types in vitro and in vivo. Bryostatin-1 is used for the treatment of melanoma, lymphomas, sarcoma, leukemias, and breast cancer, colon cancer, and lung cancer (53,54). There is abundant preclinical evidence that Bryostatin-1 may interact synergistically in hematopoietic cells with various cytotoxic drugs, including ara-C (55,56) and fludarabine (28). Based upon these and other considerations, clinical trials combining Bryostatin-1 and cytotoxic agents, such as fludarabine and ara-C, have been initiated in patients with leukemia, and initial results are encouraging (28,55,56). There are several studies showing that Bryostatin-1 inhibits the growth of human leukemia cells at nanomolar concentrations (57-59). In agreement with these studies, Bryostatin-1 in our study was clearly shown to have the most consistent and significant anti-proliferative effects at nanomolar range in CCRF-CEM cells (T-cell derived) and not in Nalm-6 cells (B-cell derived).
To investigate the mechanisms by which these anti-cancer drugs inhibited the growth of ALL cell lines, the cell cycle distribution was first analyzed. Terminal differentiation can occur when cells arrest in the G0 phase or directly in G2 phase (60). Treatment of CCRF-CEM and Nalm-6 cells by 4-HPR or 1α,25 (OH)2D3 caused an increase in accumulation of cells in G2/M (Table 2). Several studies (29,32,61) have reported 4-HPR-induced cell cycle arrest on different cancerous cells with varying effects on G0/G1, S, G2M phases. In our study, these anti-cancer drugs appear to affect the CCRF-CEM and Nalm-6 cell cycles differently perhaps due to different cell origins (T-cell- and B- cell-derived ALL cell lines). Bryostatin-1 is shown (Table 2) to have its major effects on both ALL cell types through blocking the cell cycle at G0/G1 phase. Our results are similar to previous studies examining different leukemic cells (47,61,62).
Previous studies have reported that retinoic acid derivatives and 1α,25(OH)2D3 can synergize their inhibitory effects on various cancer cells (36,37,63). Therefore, we decided to examine the inhibitory effect of 4-HPR and 1α,25(OH)2D3 in combination on proliferation of ALL cell lines. To our surprise, the combination of these two drugs inhibited proliferation of both ALL cell lines between 70-80% in comparison to a range of 15-30% inhibition when each drug was used alone (Figures 1A, 1B, 1C, and 1D). Such strong growth inhibitory effects at low nano and micro molar concentrations may play an important role in patient therapy in the future.
To further investigate whether apoptotic cell death mechanism was involved in the reduction of ALL cells treated by anti-cancer drugs, flow cytometric analyses were employed. Several previous studies have demonstrated induction of apoptosis by 4-HPR (29,32,64-66) and Bryostatin-1 (26,58,62,67,68) in various cancer cell types including leukemias.
In our study, these drugs generally inhibited the proliferation through apoptotic mechanism up to 20% and did not change significantly between 24 or 48 hr post treatments (Table 3). One significant finding in our study was the observation that although the Bryostain-1 induced apoptosis at similar levels than 4-HPR, the Bryostatin-1 concentrations inducing apoptosis was 1000 fold less than 4-HPR concentrations. This is particularly important if this drug is considered to be a drug of choice in chemotherapeutic treatments of patients with leukemias in the future. Notably, apoptotic effects appeared to increase in response to 1α,25(OH)2D3 at 100 nM concentration in CCRF-CEM up to 40% after 48 hr treatment (Table 3B). Interestingly similar increased induced apoptosis in CCRF-CEM cell line was observed when combination of 4-HPR and 1α,25(OH)2D3 were evaluated by flow cytometry (Table 3D). However, these effects were not observed in Nalm-6 cell line neither in 24 hr nor 48 hr post treatment. Although the inhibitory effects of 1α,25(OH)2D3 in Nalm-6 cell line appear to be more prominent (Figure 1B), flow cytometric analysis shows that this effect is mainly through necrosis and not apoptosis (results not shown). Studies of the effects of 1α,25(OH)2D3 on apoptosis are contradictory in literature and depend mostly on the cell model applied. Some investigations have shown that 1α,25(OH)2D3 induces differentiation but not apoptosis (69-71) but others have demonstrated apoptosis to be induced by 1α,25(OH)2D3 in different cancer cells (35,72,73). In our study CCRF-CEM cell line which is a T-cell derived appear to be most sensitive to 1α,25(OH)2D3. To our knowledge no previous study has demonstrated this effect on a T-cell derived cell line. This finding may help the designing of new protocols for T-ALL differentiation therapy in the future.
To gain insight into the molecular basis of apoptosis induced by the three anti-cancer compounds used in this study, we assayed for caspase-3 activity, a key cellular protein targeted during apoptosis. Caspase-3 has been shown previously to be activated in cancer cell types (29,74-76) in response to 4-HPR. Western blotting show (Figure 6) that 4-HPR, 1α,25(OH)2D3 and Bryostatin-1 promoted the cleavage of the zymogen of caspase-3 to yield the active form of caspase-3 in ALL cell lines after 24 hr exposure. Among the three drugs used in this study, 4-HPR has been previously demonstrated to induce the release of cytochrome c in CCRF-CEM human lymphoblastoid cells leading to activation of caspase pathways (77). These results suggest that caspases are the major pathways mediating apoptosis induced by 4-HPR, 1α,25(OH)2D3 and Bryostatin-1 in leukemic cells.
Currently Cluster Differentiation (CD) antigens are used to monitor treatment of patients suffering from hematologic malignancies (78). Although differentiation therapy has been widely studied in AML, there are few investigations on acute lymphoblastic leukemia, perhaps because ALL is considered a disease of differentiated lymphocytes (79). It is interesting that in most cases of ALL, transformed immature hematopoietic stem/progenitor cells with differentiation capacity are a dominant feature (39-41,80). Several studies have shown that B-cell differentiation is correlated with an up-regulation of both CD19 and CD38 expressions (42-44). To evaluate the differentiation induction capacity of 4-HPR, 1α,25(OH)2D3 and Bryostatin-1 on Nalm-6, we used flow cytometry to detect CD19 and CD38 expression levels. As the results demonstrate (Figures 4A and 4B) the three anti-cancer compounds could significantly induce phenotypic differentiation of Nalm-6 cell line. Similar results have been reported previously in B-ALL cells (42-44,79,81).
To our knowledge, no study on T-ALL differentiation induced by anticancer drugs has been reported. Therefore, to find a proper CD marker to evaluate T-ALL cell differentiation, we assayed for the presence of CD7 marker suggested in immunophenotyping and MRD studies as an important marker (82-85). As it is shown in figure 4C, 4-HPR, 1α,25(OH)2D3, and Bryostatin-1 significantly increased the expression of CD7 on CCRF-CEM cells, indicating that T-ALL cells have the capacity to respond to these anti-cancer drugs. Currently most studies are focused on demonstrating that anti-cancer drugs are effective on AML and B-ALL cells; however, our results for the first time suggest that T-ALL cells (CCRF-CEM cell line) can also be tested for drug differentiation therapy and should not be ignored in future studies.
Bryostatin-1 is clearly able to induce differentiation in monocytic leukemia cells (48,62). However, there are just few investigations on differentiation induction by Bryostatin-1 on acute lymphoblastic leukemia cells, and most of them have assayed this phenomenon on Reh, a human early pre-B acute lymphoblastic leukemia (86,87). In the present study, we, for the first time, showed that Bryostatin-1 has a potent capacity to induce differentiation on both B-ALL (Nalm-6) and T-ALL (CCRF-CEM) cell lines. Thus, Bryostatin-1 may represent the prototype of a differentiation inducer whose major role in acute lymphoblastic leukemia therapy could be as a modulator of cytotoxic drug action.
Conclusion :
In summary, this study has demonstrated that 4-HPR, 1α,25(OH)2D3, and Bryostatin-1 have anti-leukemic characteristics against both ALL B-cell and T-cell derived cell lines (Nalm-6 and CCRF-CEM). Furthermore, we have shown that the combination of 4-HPR and 1α,25(OH)2D3 increased the inhibition of proliferation and apoptosis synergistically at low micro and nanomolar levels. This finding may be quite significant if these drugs are to be used for differentiation therapy of ALL patients in the clinic in the future. We are reporting a consistent anti-proliferative and apoptotic effects of Bryostatin-1 in ALL T-cell derived cell line with the lowest ED50, making it potentially an accepted drug of choice in the clinic. This is important particularly due to insensitivity of T-cells to current chemotherapies for treatment of T-ALL patients.
The results from this study strongly indicate that the anti-leukemic effects of 4-HPR, 1α,25(OH)2D3, and Bryostatin-1 are mediated by targeting cell proliferation, cell cycle distribution, apoptosis and differentiation in ALL cell types. Further studies are warranted to evaluate the therapeutic efficacy of this class of agents in vivo.
Acknowledgement :
This work was supported by a grant from Monoclonal Antibody Research Center at Avicenna Research Institute. We thank Mr. Torkabadi for his help in flow cytometry analyses and Mr. Lakpour, Mr. Bayat, Miss. Einy, and Mrs. Ghaempanah for their help and technical assistance. We especially thank Dr. Jeddi-Tehrani for his support throughout this study.
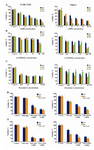
Figure 1. Effect of (A) 4-HPR, (B) 1α,25(OH)2D3, and (C) Bryostatin-1 on proliferation of two ALL cell lines (CCRF-CEM, Nalm-6). (D and E) Synergistic effects of 4-HPR and 1α,25(OH)2D3 (VD3) on proliferation of CCRF-CEM and Nalm-6 cells. Results show the mean±S.E.M. of three independently performed experiments. Each concentration was tested in eight wells per experiment. P-values are for individual treatment groups compared to control (*p<0.001, **p<0.01, # p<0.05)
|
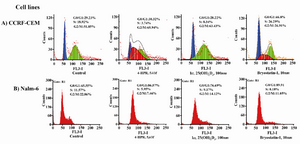
Figure 2. Effects of 4-HPR, 1α,25(OH)2D3, and Bryostatin-1on cell cycle distribution of CCRF-CEM and Nalm-6 cells. ALL cells were cultured with anti-cancer drugs. After 24 hr, cell distribution was analyzed by flow cytometry
|
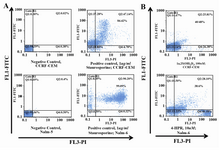
Figure 3. Flow cytometric analysis of cell surface molecules on Nalm-6 and CCRF-CEM cells treated with 4-HPR, 1α,25(OH)2D3, and Bryostatin-1. Nalm-6 cells were assessed via flow cytometric analysis using PE-conjugated anti-CD19 mAb (A) or anti-CD38 mAb (B), 24, 48 and 72 hr post treatment. (C) Expression of CD7 by CCRF-CEM cells using FITC-conjugated anti-CD7 mAb. Results represent the mean±S.E.M. of three separate experiments. P-values are for individual treatment groups compared to control (*p < 0.001, **p < 0.01, # p < 0.05).
|
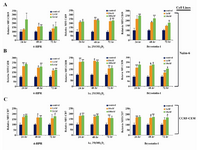
Figure 4. Flow cytometric analysis of cell surface molecules on Nalm-6 and CCRF-CEM cells treated with 4-HPR, 1α,25(OH)2 D3, and Bryostatin-1. Nalm-6 cells were assessed via flow cytometric analysis using PE-conjugated anti-CD19 mAb (A) or anti-CD38 mAb (B), 24, 48 and 72 hr post treatment. (C) Expression of CD7 by CCRF-CEM cells using FITC-conjugated anti-CD7 mAb. Results represent the mean±S.E.M. of three separate experiments. MIF is the mean fluorescence intensity (expressed as the ratio of sample mean channel:control mean channel). P-values are for individual treatment groups compared to control (*p<0.001, **p<0.01, # p<0.05)
|
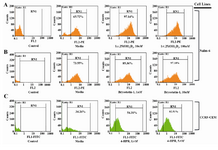
Figure 5. Effects of 1α,25(OH)2D3 (VD3) on CD19(A), bryostatin-1 (Bryo1) on CD38(B) and fenretinide (4-HPR) on CD7(C) expressions in ALL cell lines after 72 hr treatment. The cells stained with PE-or FITC- conjugated isotype mAbs were used as a control
|
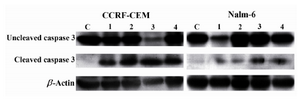
Figure 6. Effects of bryostatin-1 (Lane 2), 1α,25(OH)2D3 (Lane 3), and 4-HPR (Lane 4) on activation of caspase-3 (cleaved form) in CCRF-CEM and Nalm-6 cell lines 24 hr post treatment. C: negative control; Lane 1: positive con-trol representing ALL cells treated with Staurosporine.
β-actin: loading control
|
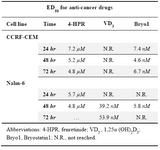
Table 1. Concentrations of anti-cancer drugs that produced 50% growth inhibition (ED50) of ALL cells
ED50 was determined by plotting the inhibition of cell proliferation (MTT assay) in the presence of increasing concentration of 4-HPR (1-10 µM), VD3 (0.1-100 nM), and Bryo-1 (0.1-10 nM)
|
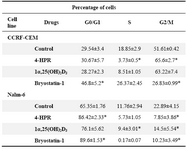
Table 2. Effects of anti-cancer drugs on ALL cell cycle distribution
Effects of anti-cancer drugs on cell cycle distribution of CCRF-CEM and Nalm-6 cells. ALL cells were plated in a 24-well plate and cultured with 4-HPR (5 µM), 1α,25(OH)2D3 (100 nM), and Bryostatin-1 (10 nM). After 24 hr, cell distribution was analyzed by flow cytometry. Results represent the mean±S.E.M. of three separate experiments. P-values are for individual treatment groups compared to control (*p<0.05)
|
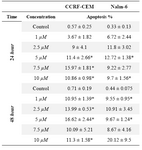
Table 3. Apoptosis induction by (3A) 4-HPR, (3B) 1α,25(OH)2D3, and (3C) Bryostatin-1 in ALL cell lines. (3D) Apoptosis induction by combination of 4-HPR and 1,25α (OH)2D3 in CCRF-CEM and Nalm-6 cells
Table 3A. Apoptosis induction by 4-HPR
|
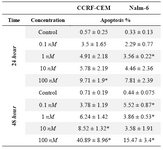
Table 3. Apoptosis induction by (3A) 4-HPR, (3B) 1α,25(OH)2D3, and (3C) Bryostatin-1 in ALL cell lines. (3D) Apoptosis induction by combination of 4-HPR and 1,25α (OH)2D3 in CCRF-CEM and Nalm-6 cells
Table 3B. Apoptosis induction by 1α,25(OH)2
|
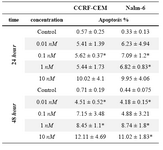
Table 3. Apoptosis induction by (3A) 4-HPR, (3B) 1α,25(OH)2D3, and (3C) Bryostatin-1 in ALL cell lines. (3D) Apoptosis induction by combination of 4-HPR and 1,25α (OH)2D3 in CCRF-CEM and Nalm-6 cells
Table 3C. Apoptosis induction by Bryostatin
|
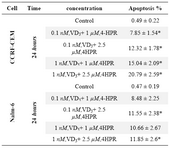
Table 3. Apoptosis induction by (3A) 4-HPR, (3B) 1α,25(OH)2D3, and (3C) Bryostatin-1 in ALL cell lines. (3D) Apoptosis induction by combination of 4-HPR and 1,25α (OH)2D3 in CCRF-CEM and Nalm-6 cells
3D. Apoptosis induction by combination of 4-HPR and VD3
Results (mean±S.E.M. of three separate experiments) are the percentage of cells positive for annexin V. P-values are for individual treatment groups compared to control (*p<0.05)
|
|