Investigation of Expression Profile of Placenta-specific 1 (PLAC1) in Acute Myeloid and Lymphoid Leukemias
-
Gholami , Parastou
-
Department of Immunology, School of Medicine, Shahid Beheshti University of Medical Sciences, Tehran, Iran
-
Asgarian-Omran, Hossein
-
Department of Immunology, School of Medicine, Mazandaran University of Medical Sciences, Sari, Iran
-
Yaghmaei, Marjan
-
Hematology-Oncology and Stem Cell Transplantation Research Center, Tehran University of Medical Sciences, Tehran, Iran
-
Mahmoudian, Jafar
-
Monoclonal Antibody Research Center, Avicenna Research Institute, ACECR, Tehran, Iran
-
Kianersi, Shirin
-
HSCT Research Center, Shahid Beheshti University of Medical Sciences, Tehran, Iran
-
Salari , Sina
-
HSCT Research Center, Shahid Beheshti University of Medical Sciences, Tehran, Iran
-
Zaboli, Ehsan
-
Gastrointestinal Cancer Research Center, Mazandaran University of Medical Sciences, Sari, Iran
-
Jeddi-Tehrani, Mahmood
-
Monoclonal Antibody Research Center, Avicenna Research Institute, ACECR, Tehran, Iran
-
Zarnani, Amir-Hassan
-
Department of Immunology, School of Public Health, Tehran University of Medical Sciences,, Tehran, Iran
-
Reproductive Biotechnology Research Center, Avicenna Research Institute, ACECR,, Tehran, Iran
-
 Shabani, Mahdi
Department of Immunology, School of Medicine, Shahid Beheshti University of Medical Sciences, Tehran, Iran, Tel/Fax: +98 21 22439970; E-mail: msshabani@sbmu.ac.ir; msshabani@yahoo.com
Shabani, Mahdi
Department of Immunology, School of Medicine, Shahid Beheshti University of Medical Sciences, Tehran, Iran, Tel/Fax: +98 21 22439970; E-mail: msshabani@sbmu.ac.ir; msshabani@yahoo.com
Abstract: Background: Placenta-specific 1 (PLAC1) is one of the cancer-testis-placenta antigens that has no expression in normal tissue except placenta trophoblast and testicular germ cells, but is overexpressed in a variety of solid tumors. There is a lack of studies on the expression of PLAC1 in leukemia. We investigated expression of PLAC1 in Acute Myeloid Leukemia (AML) and Acute Lymphoblastic Leukemia (ALL).
Methods: In this study, we investigated expression pattern of PLAC1 gene in peripheral blood and bone marrow mononuclear cells of newly-diagnosed patients with AML (n=31) and ALL (n=31) using quantitative real-time PCR. Normal subjects (n=17) were considered as control. The PLAC1 protein expression in the samples were also detected using western blotting.
Results: Our data demonstrated that PLAC1 transcripts had 2.7 and 2.9 fold-change increase in AML and ALL, respectively, compared to normal samples. PLAC1 transcript expression was totally negative in all studied normal subjects. Level of PLAC1 mRNA expression in ALL statistically increased compared to normal samples (p=0.038). However, relative mRNA expression of PLAC1 in AML was not significant in comparison to normal subjects (p=0.848). Furthermore, relative mRNA expression of PLAC1 in AML subtypes was not statistically significant (p=0.756). PLAC1 gene expression showed no difference in demographical clinical and para-clinical parameters. Western blotting confirmed expression of PLAC1 in the ALL and AML samples.
Conclusion: Considering PLAC1 expression profile in acute leukemia, PLAC1 could be a potential marker in leukemia which needs complementary studies in the future.
Introduction :
Acute Myeloid Leukemia (AML) is a heterogeneous disorder of hematopoietic stem cells that mainly affects middle-aged people (mean age of diagnosis is 69 years). AML is seen with uncontrolled clonal proliferation of myeloid progenitor cells leading to defects in normal hematopoiesis 1. It is the most common acute leukemia that accounting for about 80% of cases in this group. In the United States, the incidence of AML is 3-5 cases per 100000 population and over 20000 per year 2. Acute Lymphoblastic Leukemia (ALL) is a clonal malignancy characterized by the accumulation of lymphocyte blasts that do not differentiate into adult lymphocytes 3. ALL is the most common cancer among children and the most important cause of cancer death in people under 20 years of age 4. The disease appears to begin with genetic mutations in hematopoietic stem cells. These mutations accumulate in stem cells to eventually lead to three functional disorders, including increased proliferation, cessation of blast differentiation, and decreased apoptotic death 5. There is no tumor marker with a wide expression pattern in the acute leukemia that could be applicable in general diagnosis or targeting leukemic cells, thus scientists are now searching for such biomarker.
Placenta-specific 1 (PLAC1) is an X-linked (Xq26) gene with a conserved structure in mice and humans that is involved in placental evolution 6,7. It has six exons located in an area of about 200 Kbp, with only one protein-containing transcript in humans (NP-068568.1, ENS T00000359237) 7. PLAC1 has two promoters, P1 and P2, which are about 100 Kbp apart, but all 639 bp that contain the gene coding sequence are in the exon 6. Therefore, the PLAC1 protein is the product of the last and the largest exon of PLAC1 gene 8. Keratinocyte Growth Factor (KGF) increases the expression of PLAC1 transcript by 2-3 times. This factor plays a role in regulating placental function and differentiation in mammals 9. In healthy individuals, the expression of PLAC1 is mainly limited to placental tissue and its lower levels of mRNA expression have been reported in the testes 10,11 and cerebellum 11,12.
In humans, PLAC1 protein is found in placenta with relatively constant expression during pregnancy 9,13. The PLAC1 protein is found in the apical syncytiotrophoblast 7,13 and has been shown to bind to F-actin at the membrane and apical syncytial trophoblast levels. Studies have shown that PLAC1 protein is associated with membranes and is predominantly found in microvillous brush border membranes 7. In vitro studies have shown that silencing PLAC1 gene using siRNA in MCF-7 and BT-544 cell lines reduces motility, migration, and invasion, as well cell cycle arrest leading to a reduction of about 80-90% in cell proliferation. Decreased PLAC1 expression was associated with decreased in cyclin D1 expression and AKT kinase phosphorylation 14. Importantly, PLAC1 expression in both mRNA and protein levels were detected in a verity of malignancies including hepatocellular carcinoma 15, ovarian cancer 16, prostate cancer 17, melanoma 18, gastric adenocarcinoma 19 and breast cancer 20.There is a lack of study on the expression of PLAC1 in leukemia such as AML and ALL. Based on popularity of this type of cancers, here we investigated the expression pattern of PLAC1 in the newly-diagnosed patients with AML and ALL.
Materials and Methods :
Samples collection: Sixty two EDTA-anticoagulated Peripheral Blood (PB) and Bone Marrow (BM) samples were obtained from AML (BM=13, and PB=18) and ALL (BM=16, and PB=15) patients that had refreed to Blood and Oncology Department of Imam Khomeini Hospital (Mazandaran University of Medical Sciences), Hematology Research Center of Oncology and Stem Cell Transplantation (Tehran University of Medical Sciences) or Taleghani Hospital (Shahid Beheshti University of Medical Sciences) during October 2018 to September 2019 (Table 1). Blood samples were also taken from 17 normal healthy individuals (the mean age: 35.6 years; SD: 12.9 and 64.7% male) for the control group. A consent letter was taken from all patients and control group. This study was approved by the Ethical Committee of Shahid Beheshti University of Medical Sciences (IR.SBMU.MSP.REC.1398.328).
RNA Extraction and cDNA preparation: Mononuclear cells were immediately isolated by Ficoll density centrifugation, and washed twice with Phosphate Buffered Saline (PBS, pH=7.2, 0.15 M). The separated cells were lysed in Trizol reagent (Yekta Tajhiz Azma, Iran). Total RNA extraction was performed following the manufacturer’s instructions. Single-stranded cDNA preparation was performed from 1 µg total RNA of each sample using reverse transcriptase (Thermo Scientific, Lithuania) and random primer (Cybergene, Sweden).
Quantitative RT-PCR: We used the SYBR green (Yekta Tajhiz Azma, Iran) to determine PLAC1 expression levels. The specific primers were used as follows: PLAC1 sense, 5'-GTGAGCACAAAGCCACATTTC-3' and antisense, 5'-GCAGCCAATCAGATAATGAACC-3'; GAPDH sense, 5'- GAAGGTGAAGGTCGGAGTC -3' and antisense, 5'-GAAGATGGTGATGGGATTTC-3' (Bioneer, Korea). The quantitative PCR (qPCR) assays were conducted on a Corbett rotor gene 6000 (QIAGEN, Germany). qPCR mainly included enzyme activation (15 min at 95°C), followed by denaturation (15 s, 95°C), annealing, extension and florescence acquiring (60 s, 60°C) for 40 cycles. The amplicons’ size of PLAC1 and GAPDH genes were 118 bp and 226 bp, respectively. qPCR results were analyzed and expressed relative to threshold cycle (CT) values and then converted to fold-change. The PLAC1 gene expression was normalized using GAPDH as house-keeping internal control and relative gene expression data presented as fold-change compared to normal group based on 2-∆∆CT method.
Western blotting: Separated mononuclear cells (1×10⁶) were lysed in 50 µl sample buffer containing 150 mM Tris Ph=6.8, 1.2% SDS, 200 mM 2-ME, 0.2% bromophenol blue and 33% glycerol on ice. The lysates were boiled for 10 min and then centrifuged at 17700×g for 20 min at 4°C. Thirty µl of cell lysates and 35 ng recombinant human PLAC1 (rhPLAC1) (produced in Dr. Zarnani’s lab) were run on a 14% SDS-PAGE gel at 100 V for 2 hrs and then transferred to PVDF membrane at 200 mA for one hr. The existence of protein bands was visualized by Ponceau S staining. The membrane was blocked with PBS-0.1% Tween 20 (PBS-T) containing 5% skimmed milk solution overnight without shaking at 4°C. The membrane was then immunoprobed with rabbit anti-rhPLAC1 antibody (produced in Dr. Zarnani’s lab) at 2 µg/ml in PBS-T containing 1% skimmed milk solution for 1.5 hr with shaking at RT followed by goat anti-rabbit IgG-HRP (1:6000) (Bio-Rad, Hercules, CA, USA) in PBS-T containing 1% skimmed milk solution for one hr with shaking at RT. After extensive washing, membrane was developed with ECL. Anti-β-actin rabbit monoclonal antibody (Sigma, St. Louis, USA) was used for visualization of β-actin after re-probing of the membrane.
Statistical analysis: IBM SPSS statistics 26 (SPSS Inc., Chicago, IL, USA), and the REST software was used for the statistical analysis. The results of data analysis are reported based on p value and in the form of tables and graphs. In a quantitative study, the Kolmogrov-Smirnov test was used to determine whether the data distribution was normal or abnormal. Because the distribution of our study data was abnormal, non-parametric statistical tests such as Kruskal Wallis and Man-Whitney U tests were used to compare the means between several groups and the two groups, respectively, and to determine the correlation between quantitative parameters performed by Spearman Correlation Test. The results with p<0.05 were considered statistically significant.
Results :
Relative expression analysis of PLAC1 by real time PCR: Specific amplification of the GAPDH and PLAC1 genes were confirmed by agarose gel electrophoresis. The amplicons’ size of PLAC1 and GAPDH genes were compatible with the expected sizes as 118 bp and 226 bp, respectively (Figures 1A and B). The amplicon and melting curves of the GAPDH and PLAC1 was also confirmed with their specific amplification (Figure 2). Furthermore, PLAC1 PCR product of one AML sample was confirmed by Sanger sequencing (ABI 3500 genetic analyzer, Thermofisher Scientific, Waltham, MA, USA; data not shown). In addition, the efficiency of PLAC1 (96%) and GAPDH (98%) amplification was validated using MDA-MB-231 cells, as positive control.
Our data demonstrated that PLAC1 transcripts had 2.9 fold-change increase in ALL compared to normal samples. Further analysis pointed out that the level of PLAC1 mRNA expression in both PB and BM mononuclear cells of ALL patients was significantly higher compared to normal samples (p=0.038) (Figure 3). Interestingly, PLAC1 transcript expression compared to normal control group was statistically significant just in B-ALL but not in T-ALL subtype (p=0.029) (Figure 3). Furthermore, PLAC1 expression was significantly different just in BM and PB samples of B-ALL (p=0.04), but not in T-ALL.
Furthermore, PLAC1 transcripts had 2.7 fold-change increase in AML compared to normal samples. But despite of ALL samples, relative mRNA expression of PLAC1 in AML samples was not significantly different compared to normal samples (p=0.848) (Figure 3). Furthermore, relative mRNA expression of PLAC1 in AML subtypes was not statistically significant (p=0.756). In comparison to normal PB samples, PLAC1 expression was significantly higher in PB (p=0.011) and BM blasts (p=0.029) of AML and ALL patients. Analysis of PLAC1 expression showed that PLAC1 had no difference in demographical clinical and para-clinical subgroups.
PLAC1 protein expression by Western blotting: PLAC1 expression at protein level in 5 samples was checked in immunoblotting using a rabbit polyclonal antibody specific to human PLAC1 recombinant protein (produced in Dr. Zarnani's laboratory). Based on the immunoblotting findings, the expression of PLAC1 protein was consistent with the expression of PLAC1 gene, and samples with positive PLAC1 transcript had PLAC1 protein expression, too. Representative Western blot results with anti-PLAC1 and β-actin antibodies are presented in figure 4, as expected PLAC1 and β-actin showed 24 and 42 kDa sizes, respectively.
Discussion :
Due to the lack of access to a suitable biomarker that can be used as a diagnostic marker in all AML or ALL patients, we investigated the expression of PLAC1 transcript in these leukemias. In this study the expression of PLAC1 transcript is detected in ALL and AML to a significant extent, which requires more examination on a larger number of samples. In addition to quantitative analysis of PLAC1 real-time PCR, we arbitrary considered samples with CT ≤34 as positive and the cases with CT ≥35 as negative for PLAC1 mRNA expression. According to this criterion, PLAC1 expression was positive in 67.7% of ALL and 48.3% of AML patients. In this regard, PLAC1 gene expression was negative in all included normal samples. Furthermore, PLAC1 expression was detected in 69.2 and 60% of B-ALL a nd T-ALL, respectively. Although, the sample size of different subgroups of B-ALL was very small, interestingly Pre-B ALL subtype had the highest PLAC1 expression (6 out of 9; 65.2%). This finding was also found in AML-M1 with 71.4% (5 out of 7 cases) as the highest frequency of PLAC1 positive samples among AML FAB subtypes. In addition, the expression of PLAC1 transcript was examined in normal healthy individuals and none of the normal individuals had PLAC1 transcript in PB samples, which is a confirmation of the lack of expression of PLAC1 molecule in normal tissues except placenta and testis 10.
Identification of genes that are expressed in tumors and have no expression in normal tissues is a prerequisite for the study of cancer immunotherapy. Identification of these genes will also help advance diagnosis and treatment, including tumor immunotherapy. PLAC1 is a molecule of the cancer testis family of antigens that is expressed in placental and testicular tissue but is not expressed in normal tissues, according to published studies 10. Xue-Yuan Dong et al showed that PLAC1 is highly expressed in hepatocellular carcinoma tissue and anti-PLAC1 antibodies have been found it in the serum of patients which indicated its immunogenicity 15. Nana E. Tchabo et al showed that PLAC1 and DPPA2 were among the testicular cancer antigens (CTA) that were expressed on 21 and 31% ovarian epithelial cancer, respectively 16.
In another study Roya Ghods et al examined the pattern of expression of the PLAC1 gene in advanced prostate adenocarcinoma. They reported that in prostate cancer, as the expression of PLAC1 increased, the expression of (prostate specific antigen) PSA decreased 18. In another study by Roya Ghods et al on melanoma, 100% of PLAC1 expression on melanoma tissues was observed 19. Fangfang Liu et al proposed PLAC1 as a potential biomarker in the diagnosis and treatment of gastric adenocarcinoma 20. In a study on breast cancer by Hongyan Yuan et al, PLAC1 was detected as a biomarker in the serum of 40-60% of breast cancer patients 21. Yongfei Li and colleagues showed that following the interaction of PLAC1 with Furin, the intracellular domain of Notch1 transcription factor, called NICD, is activated and inhibits PTEN suppressor tumor expression, a pathway leads to tumor progression, proliferation and metastasis. Therefore, high expression of PLAC1 in breast cancer is associated with poor prognosis, migration and tumor invasion 22. Qiongshu Li and colleagues investigated the targeting of PLAC1 in breast cancer using genetically engineered T cells against PLAC1 (CAR-T-PLAC1 cells) 23. All reported studies indicated the importance of PLAC1 in biology of tumors and the potential applications of this molecule in diagnosis and therapy of PLAC1 positive cancers.
Conclusion :
In conclusion, due to the lack of PLAC1 expression in normal samples and its expression in ALL and AML patient samples, PLAC1 can be considered as a tumor-specific antigen or tumor-dependent antigen, which seems to be expressed in some ALL and AML patients. Additional studies are suggested in more samples in each leukemia group and with better homogeneity, for stronger results.
Statement of Ethics :
The Shahid Beheshti University of Medical Sciences research committee approved the study (IR.SBMU. MSP.REC.1398.328). All experiments or tests performed involving human subjects were conducted according to the institute ethical standards and the Declaration of Helsinki. Samples of 1-2 ml of aspirated bone marrow and 3-5 ml of peripheral blood were collected in vials containing EDTA after obtaining the signature of the patient or the patient’s guardian on an informed consent form as approved by Shahid Beheshti University of Medical Sciences Research Committee.
Data Availability Statement :
The dataset used and analyzed during the current study are available from the corresponding author upon reasonable request.
Acknowledgement :
This work is financially supported by Shahid Beheshti University of Medical Sciences (grant number: 15082). This work is part of Parastou Gholami’s thesis. We appreciate Ms. Sedighe Vafaei for letting us have her valuable experience on setting up Western blot.
Conflict of Interest :
All authors declare that there is no conflict of interest.
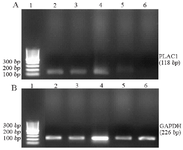
Figure 1. Agarose gel electrophoresis of real-time PCR products of PLAC1 (A) and GAPDH (B).
Lanes 1: marker 100 bp, 2: AML12-BM, 3: AML7-PB, 4: ALL1-BM, 5: ALL23-PB, 6: Normal 4.
|
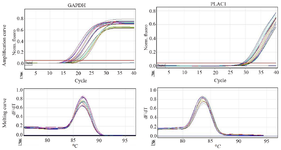
Figure 2. The real time PCR amplification curve and melting curve of PLAC1 and GAPDH.
|
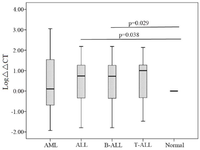
Figure 3. Comparison of PLAC1 mRNA expression in leukemic and normal groups.
|
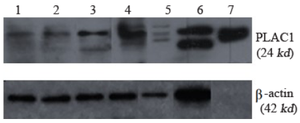
Figure 4. Representative data on PLAC1 protein expression pattern in AML and ALL patients. PLAC1 and β-actin proteins bands laid on 21 and 42 kDa in SDS-PAGE 10%.
Lanes 1: AML21-PB, 2: AML23-PB, 3: ALL25-PB, 4: ALL27-PB, 5: ALL19-BM, 6: human placenta, 7: PLAC1 recombinant protein.
|
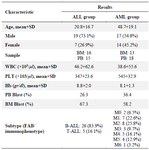
Table 1. Demographic and laboratory findings of studied acute myeloid leukemia (AML) and acute lymphoblastic leukemia (ALL)
|
|