Cobalt Zinc Ferrite Nanoparticles as a Potential Magnetic Resonance Imaging Agent: An In Vitro Study
-
Ghasemian, Zeinab
-
Department of Medical Physics, Faculty of Medicine, Isfahan University of Medical Sciences, Isfahan, Iran
-
 Shahbazi-Gahrouei, Daryoush
Department of Medical Physics, Faculty of Medicine, Isfahan University of Medical Sciences, Isfahan, Iran, Tel: +98 31 37922495; E-mail: shahbazi24@yahoo.com & shahbazi@med.mui.ac.ir
Shahbazi-Gahrouei, Daryoush
Department of Medical Physics, Faculty of Medicine, Isfahan University of Medical Sciences, Isfahan, Iran, Tel: +98 31 37922495; E-mail: shahbazi24@yahoo.com & shahbazi@med.mui.ac.ir
-
Department of Medical Physics, Faculty of Medicine, Isfahan University of Medical Sciences, Isfahan, Iran
-
Manouchehri, Sohrab
-
Department of Physics, Nano-center, Maleke-ashtar University of Technology, Shahin-shahr, Isfahan, Iran
Abstract: Background: Magnetic Nanoparticles (MNP) have been used for contrast enhancement in Magnetic Resonance Imaging (MRI). In recent years, research on the use of ferrite nanoparticles in T2 contrast agents has shown a great potential application in MR imaging. In this work, Co0.5Zn0.5Fe2O4 and Co0.5Zn0.5Fe2O4-DMSA magnetic nanoparticles, CZF-MNPs and CZF-MNPs-DMSA, were investigated as MR imaging contrast agents.
Methods: Cobalt zinc ferrite nanoparticles and their suitable coating, DMSA, were investigated under in vitro condition. Human prostate cancer cell lines (DU145 and PC3) with bare (uncoated) and coated magnetic nanoparticles were investigated as nano-contrast MR imaging agents.
Results: Using T2-weighted MR images identified that signal intensity of bare and coated MNPs was enhanced with increasing concentration of MNPs in water. The values of 1/T2 relaxivity (r2) for bare and coated MNPs were found to be 88.46 and 28.80 (mM–1 s–1), respectively.
Conclusion: The results show that bare and coated MNPs are suitable as T2-weighted MR imaging contrast agents. Also, the obtained r2/r1 values (59.3 and 50) for bare and coated MNPs were in agreement with the results of other previous relevant works.
Introduction :
One of the most powerful non-invasive techniques for diagnosis is MR imaging which has excellent temporal and spatial (25-100 μm) resolution 1-3. The limitation of MR imaging technique is its low sensitivity that leads to unclear diagnosis of healthy tissues from abnormal tissues. Theoretically, the sensitivity in MR imaging is due to the relaxivity of magnetic spins in water protons 4. In the last decades, nanoparticle agents continue to receive considerable attention in the field of medical imaging as potential MR imaging contrast agents 5,6. Recently, magnetic nanoparticles have attracted growing interest as high performance biomaterials which are used for the diagnosis and treatment of cancers. Nowadays, more studies focus on magnetic nanoparticles as potential MR imaging contrast agents. Magnetic nanoparticles should have features such as uniform particle size 6, a uniform and high superparamagnetic moment, high colloidal stability, low toxicity and high biocompatibility 7. Magnetic nanoparticles can alter longitudinal and transverse relaxation times and thereby affect the MR image signal 8. Studies on the application of ferrite nanoparticles in T2 MR imaging contrast agents has shown great potential 5,9-11.
Saturation magnetization (Ms) value is one of the most dominant parameters that affect T2 relaxivity 12. Jun et al reported that the values of Ms are dependent on the size and composition of nanoparticles 13. Metallic nanoparticles such as iron, nickel, cobalt, or their alloys have higher magnetization value than that of oxide nanoparticles 14. For this reason, in this study, cobalt zinc ferrite (Co0.5Zn0.5Fe2O4) magnetic nanoparticles were used for further investigation.
In another study, Barcena et al found that zinc ferrite nanoparticles increased the 1/T2 relaxivity and improved the sensitivity of detection by MR imaging 3. In previous studies, special attention was given to particles coated with Dimercaptosuccinic acid (DMSA) for biomedical applications 15-17. Recently, the cytotoxicity effect of DMSA-Fe2O3 by tetrazolium dye assay on human aortic endothelial cells was reported which revealed its low cytotoxicity effect 15. Also, the cytotoxicity of CZF-MNPs and CZF-MNPs-DMSA was also demonstrated on prostate cancer cells (PC3 and DU145) 18.
The aim of this paper was to evaluate the influence of coated and uncoated magnetic nanoparticles, in particular CZF-MNPs and CZF-MNPs-DMSA, on the relaxivity of water protons as MR imaging contrast agent or molecular imaging for clinical diagnosis.
Materials and Methods :
Preparation and synthesis, characterization, coating with DMSA, and cytotoxicity of cobalt zinc ferrite nanoparticles were described in previous published papers 16,18. Briefly, cobalt zinc ferrite nanoparticles were prepared using a co-precipitation method and their characterization was assessed using of TEM (Transmission Electron Microscopy), FT-IR (Furier Transformation Infrared Spectroscopy) and magnetization measurements.
Cell culture: Human prostate cancer cells, HPCs, (DU145 and PC3) were purchased from the National Cell Bank of Iran, Pasteur Institute of Iran. They were cultured in Roswell Park Memorial Institute (RPMI) media supplemented with 1% antibiotics (100 units/ml penicillin and 100 μg/ml streptomycin) and 10% Fetal Bovine Serum (FBS) until the third passage before performing the experiments. All the cell culture materials were from Gibco, USA. Cells were grown to confluence at 37°C in 5% CO2/air. In vitro cytotoxicity (MTT assay) of coated and bare magnetic nanoparticles was evaluated using standard 3-(4, 5-dimethylthiazol-2yl)-2, 5-diphenyltetrazolium bromide (MTT) based colorimetric assay as described elsewhere 18. The cell viability was determined by the following formula:
| % Cell viability = |
Mean absorbance in test wells
Mean absorbance in control wells
|
× 100 |
Incubation of cells with the bare and coated MNPs: First, gelatin suspension 1 g was prepared from powder gelatin dissolved in 50 ml PBS solution, and put in water bath for 30 min to obtain uniform solution. Two prostate cancer cell lines (PC3 and DU145) were incubated with different concentrations (0.5, 1 and 1.5 mmol) of CZF-MNPs and CZF-MNPs-DMSA for 2 hr at room temperature in RPMI 1640 culture medium. In order to separate the particles stuck together, before adding bare and coated MNPs suspension with different concentrations into RPMI culture medium, they were sonicated for 20 min. Then, the cells were washed three times with PBS solution. In the next step, 1 ml of gelatin suspension was added to 1.5 ml Eppendorf tubes with different concentrations and stirred to obtain uniform solution. Then, the Eppendorf tubes with different concentrations were placed on ice powder until solidity was obtained in the solution. Control groups received only 1 ml of gelatin suspension.
In vitro MR imaging: These Eppendorf tubes with different concentrations were used for in vitro MR imaging characterizations. T2-weighted images were obtained using a 1.5T MRI scanner (1.5 Tesla, GE Medical system).
Relaxivity (r1 and r2) measurements: For MR imaging studies, different concentrations of coated and bare MNPs were prepared in 1.5 ml Eppendorf tubes. The longitudinal and transverse relaxation times (T1 and T2) were measured using 3 Tesla field strength (Siemens MR scanner with head coil). MR images of each sample were obtained using a standard spin-echo sequence with two following parameters:
Repetition time (TR)=4000 ms, echo time (TE)=12, 24, 36, 48, 60 and 72 ms, number of echoes (NE)=6, matrix size=512×384, pixel band width=230, slice thickness=2.5 mm, number of excitations (NEX)=3 and field of view=25 cm.
Repetition time (TR)=100, 250, 500, 1000, 2000 and 4000 ms, echo time (TE)=15 ms, number of excitations (NEX)=3, matrix size=512×384, pixel band width= 130, slice thickness=2.5 mm, number of echoes (NE)=1 and field of view=25 cm.
Results :
The surface morphology of CZF-MNPs and CZF-MNPs-DMSA was evaluated by TEM and their results are shown in previous publications 18. The findings showed that particles had almost spherical structures. Indeed, the average particle sizes of CZF-MNPs and CZF-MNPs-DMSA (co-precipitation) were 16 and 40 nm, respectively.
In vitro MR imaging: The capability and suitability of synthesized nanoparticles as MR contrast agent was confirmed using a T2-weighted image protocol by 1.5 Tesla (GE Medical system) MR imaging system. The results are shown in figure 1. This result demonstrated that both bare and coated nanoparticles have been imported in PC3 and DU145 cell lines and resulted in grating signal intensity reduction.
The T2-weighted MR image in figure 1 also shows that CZF-MNPs and CZF-MNPs-DMSA induce a negative contrast. In addition, for the same Fe content, the enhancement in intensity using CZF-MNPs is the same as the amount of CZF-MNPs-DMSA.
Relaxivity (r1 and r2) measurements: Figure 2 shows T2-weighted MR images of different concentrations of bare and coated MNPs (CZF-MNPs and CZF-MNPs-DMSA) by 3 Tesla, MR imaging system with standard spin-echo sequence (TR=1000 ms, TE=12 ms, room temperature). As can be seen from this figure, significant differences are observed between signal intensity at different concentrations of bare and coated nanoparticles. Also, the reduction of signal intensity in CZF-MNPs sample is more than that of CZF-MNPs-DMSA sample (in the same concentration). In addition, the signal intensity of CZF-MNPs was enhanced by decreasing CZF-MNPs concentrations in water solution. Two samples were prepared in dark state in the MR image where the composites (contrast agents) were collected.
Relaxivity ratio (r2/r1) is an important index to determine the ability of nanoparticles as T2 MR imaging contrast agent. T1 and T2 relaxivity values, size (nm), saturation magnetization (Ms) and r2/r1 values of CZF-MNPs and CZF-MNPs-DMSA are presented in table 1. Plots of signal intensity for CZF-MNPs and CZF-MNPs- DMSA as a function of TR and TE for different Fe (mM) concentrations of bare and coated MNPs was measured three times and their results are shown in figures 3 and 4, respectively. Two 1/T2 and 1/T1 relaxivity values of samples have been calculated and are presented in figures 5 and 6.
R2 values of relaxation rates (r1 and r2) were higher than 0.9, which indicated a good fitness for regression due to high values of r2/r1 for bare and coated MNPs. These two magnetic nanoparticles are classified as negative MR imaging contrast agents.
The lower graphs in figures 5 and 6 are related to r1 and r2 for coated MNPs which were compared to the bare MNPs. In other words, the relaxation curves for bare MNPs are steeper than that of the coated MNPs, either longitudinal or transverse relaxivity.
Discussion :
The ability of both CZF and CZF-DMSA nanoparticles was assessed in order to decrease the longitudinal (T1) and transverse (T2) relaxation times of water protons. The MR imaging study showed that both T1 and T2 relaxation times were reduced with increasing Fe (mM) concentration; hence, CZF-MNPs and CZF-MNPs-DMSA may be more favorable as negative MR imaging contrast agents. The transverse and longitudinal relaxivity (r1 and r2) of water protons were increased by increasing Fe (mM) concentration of bare and coated MNPs compared to the control group (gelatin suspension).
The values of the saturation magnetization of bare and coated nanoparticles were approximately the same and found to be 43.1 and 44.4, respectively. But, regarding r2 relaxivity of both studied magnetic nanoparticles, bare nanoparticle (CZF-MNPs) has r2 of 3-fold higher than that of coated nanoparticle (CZF-MNPs-DMSA). Although the saturation magnetization of both bare and coated MNPs was so similar but many differences between r2 relaxivitiies of two studied samples was observed. Therefore, the other factors such as particle size and shape of nanoparticles influence the relaxation time.
According to literature, factors such as synthesis method of nanoparticles and the type of their coating can affect both T1 and T2 relaxation times 9. The study of Hoque et al. showed that synthesized nanoparticles using sonochemical technique has r2 relaxivity values higher than that of co-precipitation technique 10. Findings of this study showed that r2/r1 values for CZF-MNPs and CZF-MNPs-DMSA turned out to be 59.3 and 50, respectively. MR imaging results also showed that transverse and longitudinal relaxivities were increased with increasing Fe (mM) concentration. For this reason, our findings showed that CZF-MNPs and CZF-MNPs-DMSA are desirable negative nano-contrast MR imaging agents.
Conclusion :
The values of r2 relaxivity and r2/r1 ratio showed that bare and coated MNPs may be suitable T2 contrast agents. But, the low values of r1 relaxivity, and also the low values of r2/r1 ratio indicated that bare and coated MNPs are not acceptable T1 MR imaging nano-contrast agents. Further study should be done to evaluate whether cobalt zinc ferrite nanoparticles with different coatings can be used as T2 MR imaging contrast agents. In addition, this magnetic nanoparticle should be synthesized with other methods and be coated with other different suitable materials.
Acknowledgement :
This work was supported by Isfahan University of Medical Science (IUMS).
Conflict of Interest :
None declared.
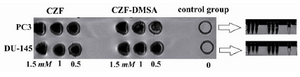
Figure 1. T2-weighted magnetic resonance images at various Fe concentrations, CZF-MNPs and CZF-MNPs-DMSA (1.5 T, Fast spin-echo sequence: TR=2520 ms, TE=102 ms, room temperature).
|
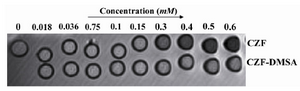
Figure 2. MR imaging signal intensity of bare and coated MNPs for different concentrations of Fe (mM) using 3 T, standard spin-echo sequence: TR=1000 ms, TE=12 ms, room temperature).
|
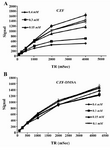
Figure 3. Plots of signal intensity for (A) CZF-MNPs and (B) CZF-MNPs-DMSA as a function of TR for different Fe concentrations (mM) of bare and coated MNPs. The signal intensity for each sample was measured three times.
|
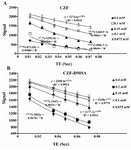
Figure 4. Plots of signal intensity for (A) CZF-MNPs and (B) CZF-MNPs-DMSA as a function of TE for different Fe concentrations (mM) of bare and coated MNPs.
|
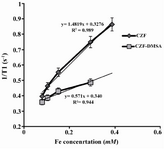
Figure 5. Plot of longitudinal relaxivity (1/T1) for CZF-MNPs and CZF-MNPs-DMSA as a function of different Fe concentrations (mM).
|
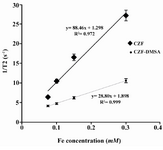
Figure 6. Plot of transverse relaxivity R2 (1/T2) for CZF-MNPs and CZF-MNPs-DMSA as a function of different Fe concentrations (mM).
|
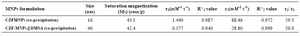
Table 1. Relaxivities r1 and r2 (at 3 T), size and saturation magnetization (Ms) of bare and coated MNPs
|
|